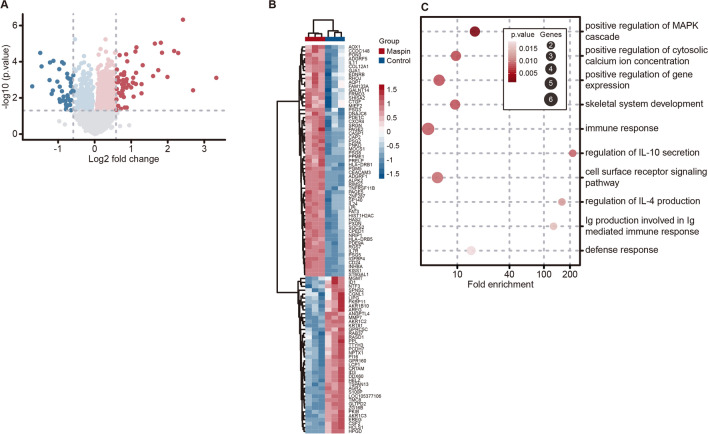
Figure 4.
Analysis of the gene expression profile in MDA-MB-231 cells stably expressing maspin or control. (A) Comparison of mRNA expression profiles between MB-231-maspin and MB-231-control cells. Volcano plot shows expression levels upregulated (red dot), downregulated (blue dot), and unchanged (gray dot) in MB-231-maspin cells. The x-axis is log2 fold change of gene expression levels between to cell lines, and the y-axis is adjusted P-value based on -log10. Red and blue dots show the differentially expressed genes (DEGs) based on P < 0.05. Deep color represents 1.5-fold expression difference. (B) Heatmap and hierarchical clustering of the DEGs with > 1.5-fold change in MB-231-maspin cells. (C) Gene ontology (GO) enrichment analysis based on the DAVID biological process term. Bubble chart represents top-10 cluster enriched in a list of iDEGs. The x-axis is fold enrichment values, and the y-axis is the enrichment term. The size of bubble represents the number of DEGs. Transparency of the bubbles represents P-value. R (ver. 4.0.2, https://www.r-project.org)23 and RStudio (Ver. 1.3.959, https://rstudio.com) software were used to plot volcano plot, heatmap, and bubble chart. Tidyverse packages (ver. 1.3.0, https://www.tidyverse.org)24 and pheatmap (ver. 1.0.12, https://CRAN.R-project.org/package=pheatmap)25 packages were used to run the software.

