Figure 5.
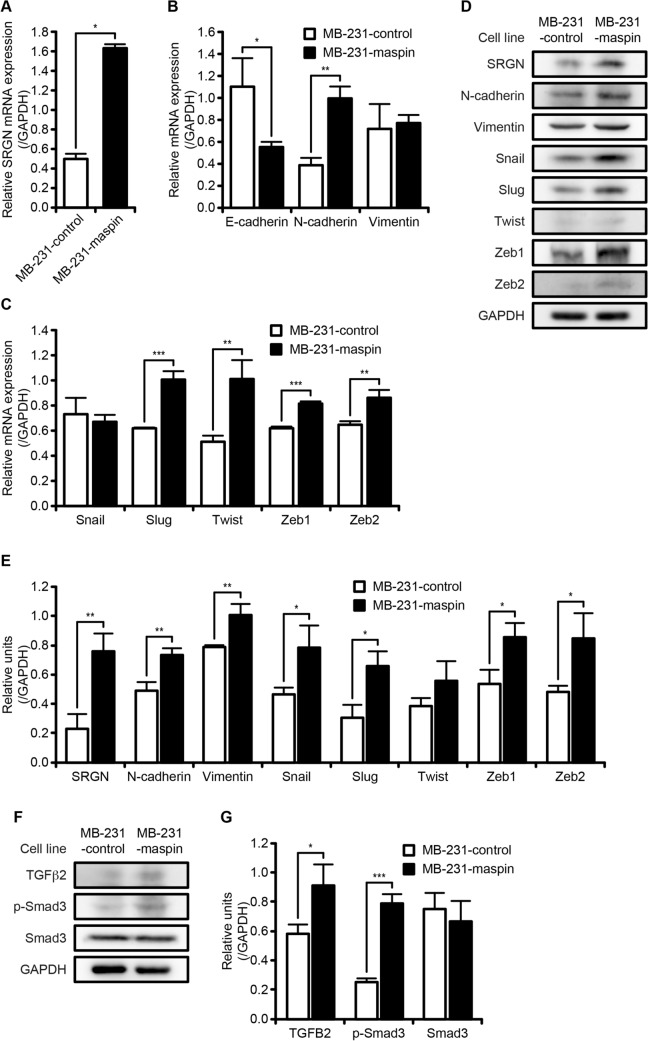
The protein expression of signaling factors involved in EMT. (A) Relative mRNA expression level of SRGN. mRNA expression was normalized to level of GAPDH. Data are shown as the mean ± SD (n = 3). *P < 0.05; Student’s t-test. (B) Relative mRNA expression levels of epithelial cell and mesenchymal cell marker. mRNA expression was normalized to level of GAPDH. Data are shown as the mean ± SD (n = 3). *P < 0.05, **P < 0.01; Student’s t-test. (C) Relative mRNA expression levels of EMT-related transcription factor. mRNA expression was normalized to level of GAPDH. Data are shown as the mean ± SD (n = 3). **P < 0.01, ***P < 0.001; Student’s t-test. (D) Protein expression levels of EMT-related markers. Expression level of GAPDH was used as a protein loading control. Whole western blots are presented in Supplementary Fig. S11. (E) Bar graph shows western blot quantification of SRGN, N-cadherin, Vimentin, Snail, Slug, Twist, Zeb1, and Zeb2. Densitometry analysis of each protein band was normalized to level of GAPDH. Data are shown as the mean ± SD (n = 3). *P < 0.05, **P < 0.01; Student’s t-test. (F) Protein expression levels of TGFβ signaling pathway factors. Expression level of GAPDH was used as a protein loading control. Whole western blots are presented in Supplementary Fig. S12. (G) Bar graph shows western blot quantification of TGFB2, phosphorylated Smad3, and Smad3. Densitometry analysis of each protein band was normalized to level of GAPDH. Data are shown as the mean ± SD (n = 3). *P < 0.05, ***P < 0.001; Student’s t-test.

