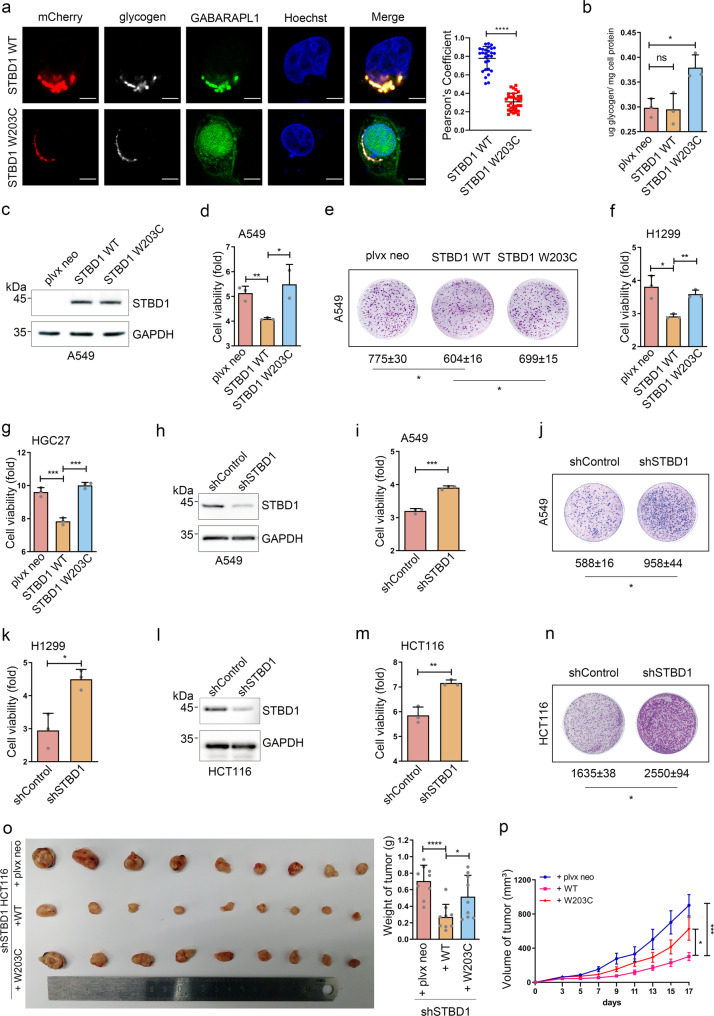
Fig. 4. STBD1 inhibits tumor growth in vitro and in vivo.
a Confocal immunofluorescence of HeLa cells co-transfected with mCherry-STBD1 WT or W203C, and GFP-tagged GABARAPL1 for 24 h. Glycogen was stained anti-glycogen monoclonal antibody IV58B6 (white) with Nuclei was stained with Hoechst (blue). Images were captured using the Olympus FV-1000. Pearson’s coefficients of glycogen and GABARAPL1 were calculated using image J. Each dot represents the value of one cell. Scale bar, 20 μm. b The glycogen content of HCT116 cells stably expressing plvx neo, STBD1 WT or STBD1 W203C, respectively, was assessed using a glycogen assay kit. c Control A549 cells (plvx neo) and A549 cells stably overexpressing STBD1 WT or W203C were lysed for immunoblotting to determine the protein levels of STBD1 and GAPDH. d Control A549 cells (plvx neo) and A549 cells stably overexpressing STBD1 WT or STBD1 W203C were cultured for 72 h. The cell viability was assessed using the MTT assay and normalized to that of 0 h. e Control A549 cells (plvx neo) and A549 cells stably overexpressing STBD1 WT or STBD1 W203C were cultured for 20 days, then stained by crystal violet. The number of colonies was analyzed using Image J. f, g Control H1299/HGC27 cells (plvx neo) and H1299/HGC27 cells stably expressing STBD1 WT or W203C were cultured for 72 h. Cell viability was then assessed using the MTT assay and normalized to that of 0 h. h The protein levels of STBD1 in shControl (control shRNA) and shSTBD1 A549 cells were determined by immunoblotting. i shControl (control shRNA) and shSTBD1 A549 cells were cultured for 72 h. The cell viability was then assessed using the MTT assay and normalized to that of 0 h. j shControl and shSTBD1 A549 cells were cultured for 20 days, then stained by crystal violet. The number of colonies was analyzed using Image J. k shControl and shSTBD1 H1299 cells were cultured for 72 h. The cell viability was then assessed using the MTT assay and normalized to that of 0 h. l The protein levels of STBD1 in shControl and shSTBD1 HCT116 cells were determined by immunoblotting. m shControl and shSTBD1 HCT116 cells were cultured for 72 h. The cell viability was then assessed using the MTT assay and normalized to that of 0 h. n shControl and shSTBD1 HCT116 cells were cultured for 20 days, then stained by crystal violet. The number of colonies was analyzed using Image J. o Nude mice (n = 9) were injected subcutaneously on the back of the neck or both flanks with shSTBD1/plvx neo, shSTBD1/WT, or shSTBD1/W203C HCT116 cells, respectively. Images show the dissected tumors and tumor weights 17 days after injection. p Tumor volume was measured over time after injection in mice as in (o). Experiments in a–n were performed in triplicate. a–p Statistical data are presented as mean ± SD. Statistical comparisons were performed using an unpaired t test. ****p < 0.0001, ***p < 0.001, **p < 0.01, *p < 0.05.

