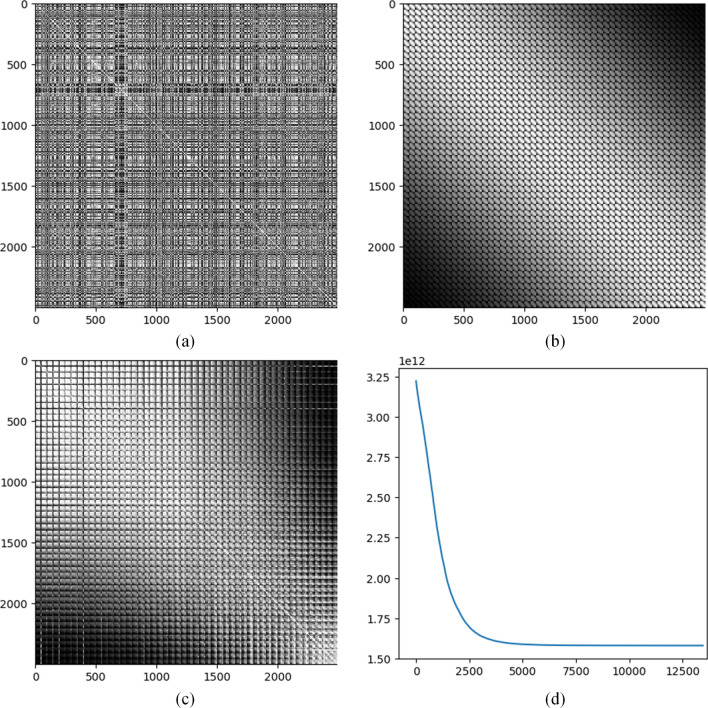
Figure 1.
An illustration of IGTD strategy based on CCL gene expression data. (a) Rank matrix of Euclidean distances between all pairs of genes. The grey level indicates the rank value. 2500 genes with the largest variations across CCLs are included for calculating the matrix. (b) Rank matrix of Euclidean distances between all pairs of pixels calculated based on their coordinates in a by image. The pixels are concatenated row by row from the image to form the order of pixels in the matrix. (c) Feature distance rank matrix after optimization and rearranging the features accordingly. (d) The error change in the optimization process. The horizontal axis shows the number of iterations and the vertical axis shows the error value.

