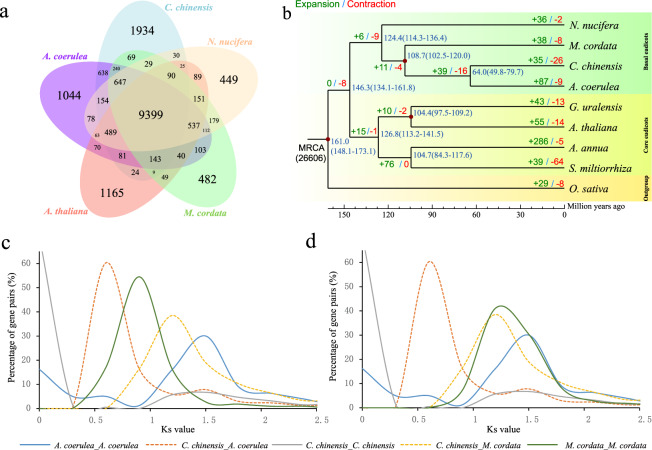
Fig. 2. Comparison of gene families.
a Venn diagrams displaying the number of gene families shared among five species. b Phylogenetic tree constructed by 817 single-copy genes. The divergence time is given in millions of years in blue. The gene families that expanded and contracted are given in green and red, respectively. c, d Percentage distribution of Ks for orthologous and paralogous gene pairs. The x-axis denotes the Ks value. The y-axis denotes the percentage of gene pairs. Rate distributions were not corrected (c); Macleaya cordata rates were corrected for Coptis chinensis (d)

