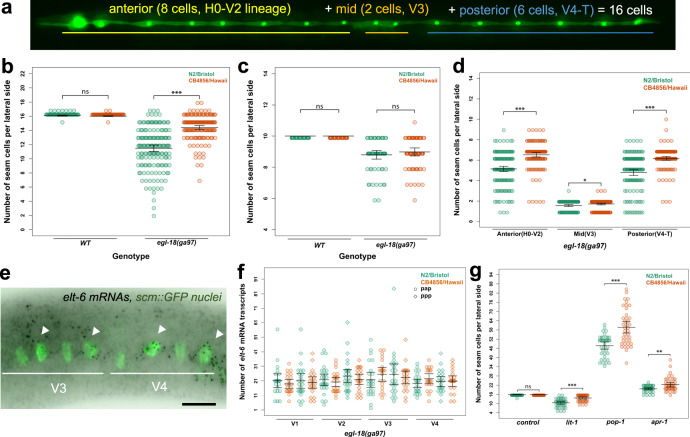
Fig. 1. The egl-18(ga97) mutation results in lower seam cell number in the N2 background compared with CB4856.
a Image depicting the stereotypic seam cell distribution in wild-type animals at the end of larval development, where eight cells are positioned anterior to the vulva (H0–V2), two cells are near the vulva (V3 lineage) and six cells are found posterior to it (V4–T). b Average terminal seam cell number (SCN) is significantly lower in N2 (green) than CB4856 (orange) carrying the egl-18(ga97) mutation (one-way ANOVA F (1, 310) = 115.02, p < 2.2 × 10⁻¹⁶, n ≥ 150), but is not different in wild-type isolates (one-way ANOVA F (1, 142) = 0.13, p = 0.13, n = 72 independent animals for wild-type and n = 150 or 162 independent egl-18 mutants in N2 and CB4856 respectively). c No statistically significant difference in SCN is found between N2 and CB4856 wild-type isolates or egl-18(ga97) mutants at the end of L1 stage with one-way ANOVA (p > 0.32, n = 60 and 64 independent egl-18 mutant animals in N2 and CB4856 and n = 25 independent animals for wild-type). d Seam cell number comparison between egl-18(ga97) mutants in N2 and CB4856 when seam cells are classified based on their position (anterior, mid, posterior). Differences in SCN are significant between the two isolates for all classes based on one-way ANOVA (F (1, 310) = 66.41, 4.87 and 61.78, *p < 0.03 and ***p < 0.0001, n ≥ 150 independent animals). e Representative smFISH image showing elt-6 expression in posterior seam cells in an egl-18 mutant at the late L2 stage. Seam cell nuclei are labelled in green due to scm::GFP expression and black spots correspond to elt-6 mRNAs. A similar pattern of expression was observed in three independent experiments. Scale bar is 20 µm. f Quantification of elt-6 expression by smFISH in N2 (n = 186 cells) and CB4856 (n = 164 cells) carrying the egl-18(ga97) mutation. No statistically significant difference in the mRNA was found with one-way ANOVA (F (1, 348) = 0.13, p = 0.72). g SCN quantification in N2 and CB4856 strains upon knockdown of lit-1, pop-1, and apr-1. There is a significant effect upon knockdown of lit-1, pop-1 and apr-1 RNAi using one-way ANOVA (F (1, 78) = 32.71, 30.27, 7.3 and 1.37, ***p < 0.0001 or **p < 0.001, n = 40 independent animals). Error bars in b–d, f, g indicate 95 % confidence intervals around the mean. Source data are provided as a Source Data file.

