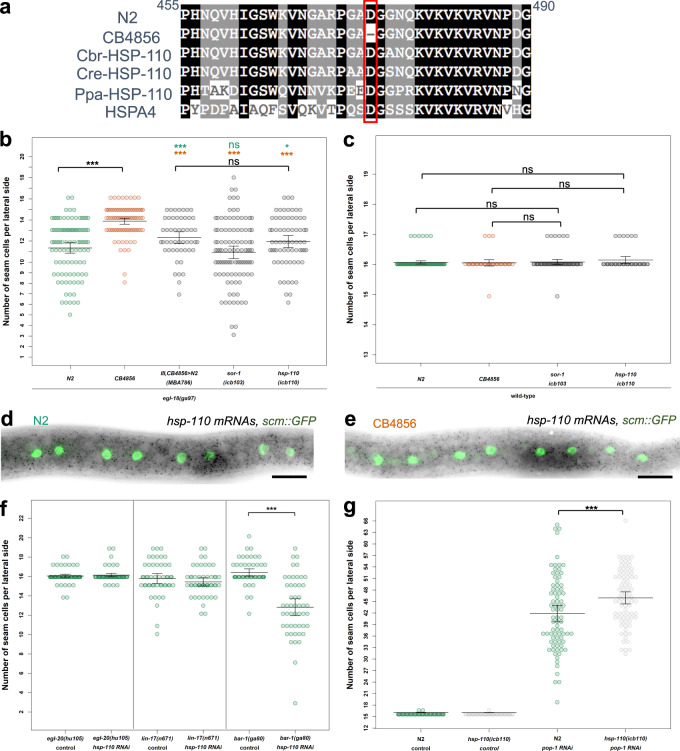
Fig. 6. Natural variation in hsp-110 contributes to the difference in phenotype expressivity between N2 and CB4856.
a Alignment of the HSP-110 amino-acid sequence from C. elegans (N2 and CB4856), C. remanei (Cre), C. brenneri (Cbr), P. pacificus (Ppa), and H. sapiens (HSPA4) around the amino-acid deletion in CB4856 (highlighted in red). b–c Comparison of seam cell counts between animals carrying the CB4856 variants of hsp-110 and sor-1 in N2 in the egl-18(ga97) (b) or wild-type background (c); n > 68 independent animals in (b) and n > 40 independent animals in c. Comparison is shown to parental isolates or the introgression of the QTL on chromosome III as a reference. Significance is tested by one-way ANOVA followed by post hoc Tukey HSD and differences are shown compared with N2 (green stars) and CB4856 (orange stars) respectively, *** corresponds to p < 0.001. d–e Representative smFISH images showing hsp-110 expression in divided seam cells in N2 or CB4856 at the late L2 stage. Seam cell nuclei are labelled in green due to scm::GFP expression and black spots correspond to hsp-110 mRNAs. A similar pattern of expression was observed in two independent experiments. Scale bar is 20 µm. f SCN quantification in N2 carrying mutations in Wnt components upon knockdown of hsp-110, (n > 49 independent animals for all strains, significance is reported with a two-tailed Welch t test; p = 0.31 for lin-17(-), p = 0.43 for egl-20(-) and p < 0.0001 for bar-1(-) mutants). Vertical lines mark independent experiments. g SCN quantification in N2 or N2 carrying the CB4856 hsp-110 allele upon knockdown of pop-1 (n = 80 independent animals). Significant change is found upon pop-1 RNAi treatment (p = 0.0008 by one-way ANOVA followed by post hoc Tukey HSD). Error bars in b–c, f–g indicate 95 % confidence intervals around the mean. Source data are provided as a Source Data file.

