Figure 3.
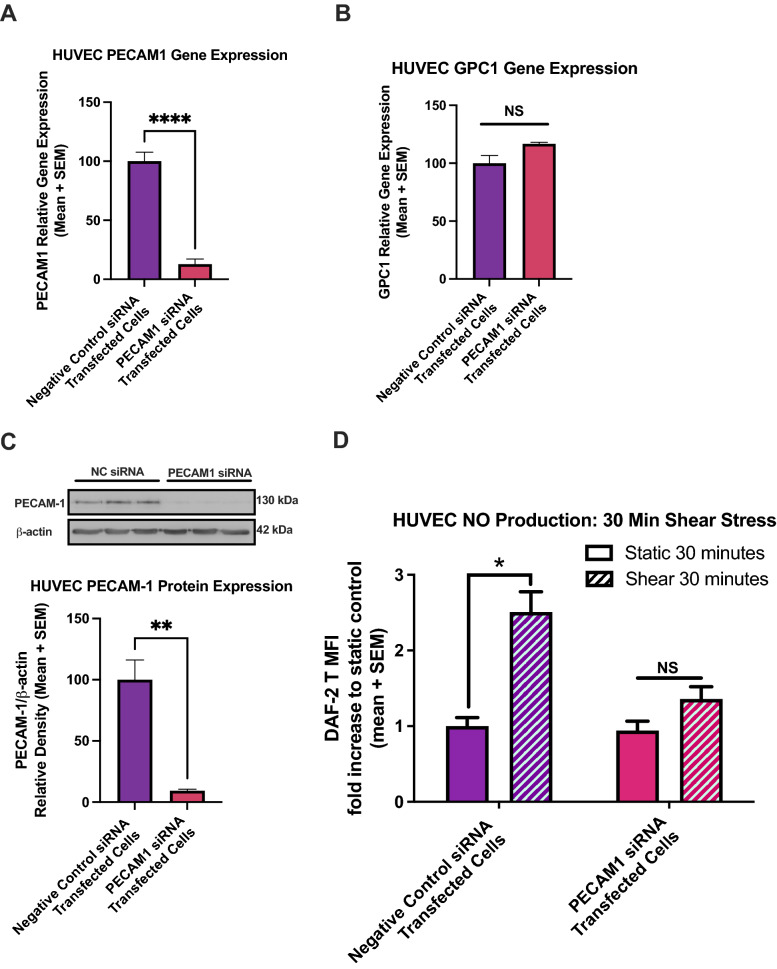
PECAM-1 knockdown blocks shear-induced NO production at 30 min in HUVEC. (A) PECAM1 gene expression is shown in cells transfected with negative control siRNA and with siRNA specific to PECAM1 mRNA (n = 10 for each group). Gene expression was normalized to GAPDH and β-ACTIN expression levels and both transfection groups were normalized to the negative control expression data, set to 100% expression. *P < 0.05 using two-tailed student’s t-test. (B) GPC1 gene expression is shown in transfected cells (n = 4 for each group). Expression levels did not significantly change using two-tailed student’s t-test. (C) PECAM-1 protein expression in transfected cells (n = 3 for each group) and corresponding western blot. *P < 0.05 using two-tailed student’s t-test. Full length blot is presented in Supplemental Figure S8. (D) DAF-2T normalized levels are shown for transfected HUVEC exposed to 30 min of fluid shear stress. From left to right, n = 8, 16, 8, 16. *P < 0.05 using one-way ANOVA followed by Sidak’s multiple comparisons test.

