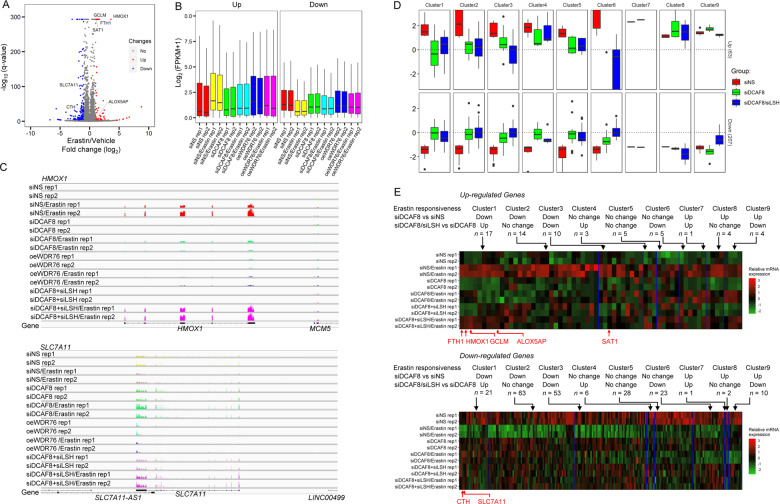
Fig. 5. Transcriptomic profiling revealed key ferroptosis genes regulated by the DCAF8/WDR76/LSH axis.
a Volcano plot shows the differentially regulated genes in HT-1080 cells treated with erastin or vehicle. The significantly altered genes (absolute fold change > 2, adjusted p value < 1e−3) were highlighted in red or blue. Ferroptosis related genes with significant expression changes were labeled. b Boxplot shows average mRNA expression levels of the differentially regulated sets of genes from a in the indicated cells. oe overexpression, rep replicate. c RNA sequencing coverage at the HMOX1 and SLC7A11 loci in the indicated cells. All the coverage tracks in the same locus have same data ranges. d Erastin responsiveness was measured as absolute value of the log2 transformed fold changes of the mRNA expression levels in cells treated with erastin relative to the mRNA levels in cells treated with vehicle. The significantly induced or suppressed genes in control cells were then partitioned into nine subgroups according to their differential responses to erastin in DCAF8 knockdown cells compared to the control cells (adjusted p value cutoff: 5e−2), and their differential responses in DCAF8/LSH co-depleted cells compared to the single DCAF8-depleted cells both in the presence of erastin (adjusted p value cutoff: 5e−2). e Gene expression matrix of the significantly induced or inhibited genes by erastin was scaled within the expression vector for the same gene and shown as a heatmap with each column representing a gene and each row representing a cellular state with indicated gene manipulations and treatment. The genes are clustered together according to their partitions in d. Ferroptosis related genes are highlighted below.

