Figure 5.
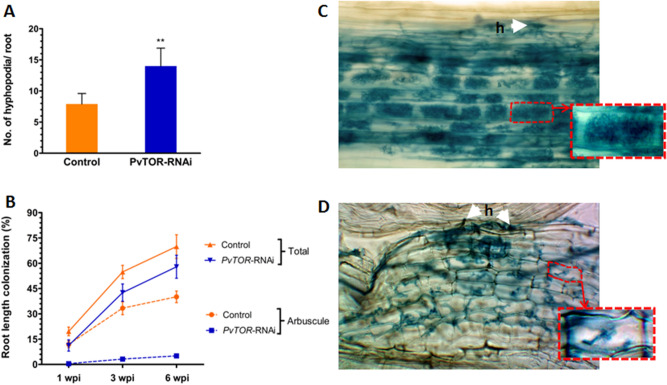
Quantification of hyphopodia and arbuscular mycorrhizal colonization in P. vulgaris PvTOR-RNAi roots. (A) Number of hyphopodia per transgenic root of control and PvTOR-RNAi bean plants at 6 wpi with R. irregularis. The statistical significance of differences between control and PvTOR-RNAi roots was determined using an unpaired two-tailed Student’s t-test (***P < 0.001). Error bars refer to the SD of the mean of three biological replicates (n > 30). (B) Total and arbuscular colonization levels in control and PvTOR-RNAi transgenic roots. The composite plants were harvested at 1, 3, and 6 wpi and mycorrhizal colonization parameters were quantified. Error bars refer to the SD of the mean of three biological replicates (n > 30). (C–D) Micrograph of R. irregularis-inoculated transgenic roots showing hyphopodia (arrowhead) and arbuscules in (C) empty vector (control) and (D) PvTOR-RNAi roots at 6 wpi. Insets show magnifications of an arbuscule containing cell (red-dashed regions). wpi, week(s) post inoculation; h, hyphopodia.

