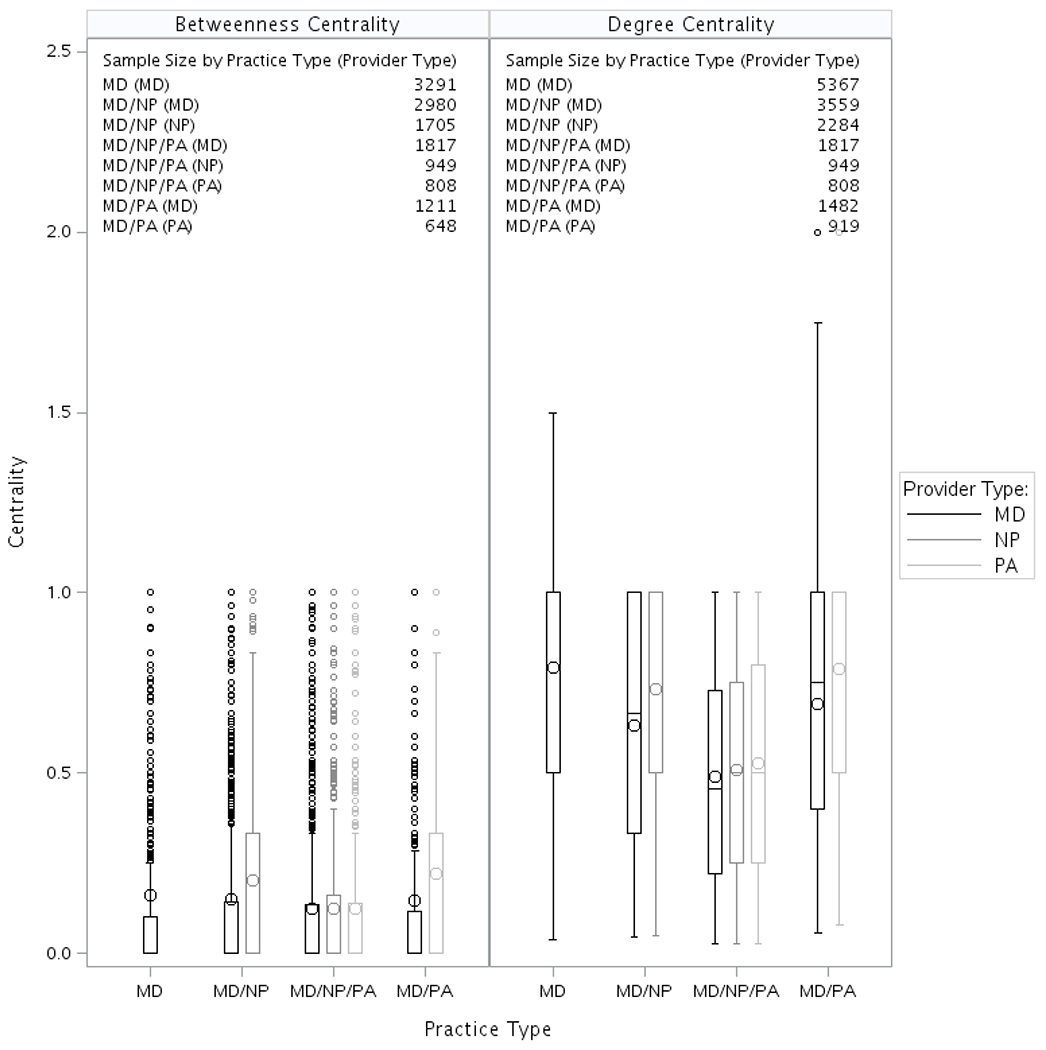
Figure 2.

Provider Network Measurement Stratified by Type of Practice for Each Type of Provider. Each box plot presents the interquartile range. The line inside the box represents the median, the large circle represents the mean, and the small circles represents those with value outside 3 times of IQR (interquartile range). The betweenness measurement is only eligible for a practice with at least 3 providers. Abbreviations: MD, primary care physician; NA, not applicable; NP, nurse practitioner; PA, physician assistant
