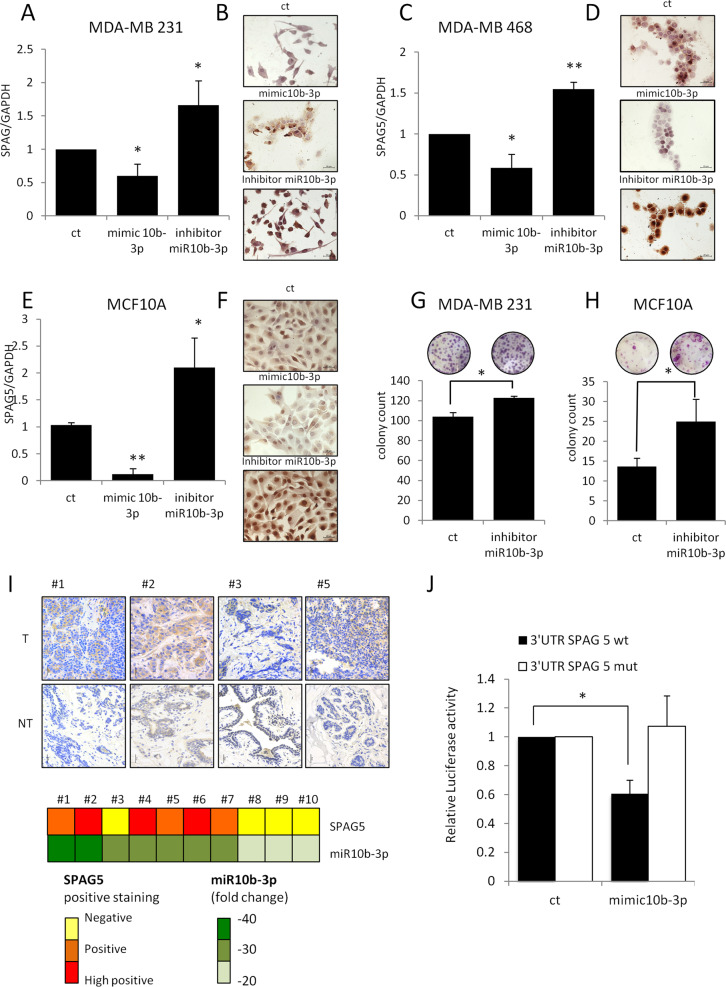
Fig. 2. miR-10b-3p affects SPAG5 expression by binding on 3’UTR.
A, C, E qPCR expression level of SPAG5 in MDA-MB-231 (A), MDA-MB-468 (C) breast cancer cell lines, and in MCF10A-untransformed breast cell lines (E) assessed by quantitative PCR after 48 h from mimic-10b-3p, miR-10b-3p inhibitor, and negative control transfection. Histograms report the means and P value from three independent experiments. B, D, F Immunocytochemistry of positive SPAG5 expression in MDA-MB-231 (B), MDA-MB-468 (D) breast cancer cell lines, and in MCF10A-untransformed breast cell lines after 48 h from mimic-10b-3p, miR-10b-3p inhibitor, and negative control transfection. G, H Clonogenic assay of MDA-MB-231 (G) and MCF-10A-untransformed breast cell lines (H) transfected with miR-10b-3p inhibitor and negative control for 48 h before seeding at clonal density. I Immunohistochemistry of SPAG5 expression in a representative matched breast tumor and nontumoral tissues. In the lower panel, the heatmap shows expression levels of miR-10b-3p and SPAG5 for each tumor tissue. SPAG5 level was calculated using H score. miR-10b-3p expression was assessed by qRT-PCR. J Luciferase assay expression vectors carrying a luciferase reporter followed by the wild-type or mutated 3′-UTR regions of SPAG5 were transfected in HEK-293T cells in the presence of mimic-10b-3p and negative control. Normalized luciferase-activity values and P value from three independent experiments are shown (*P value <0.05; **P value <0.001).

