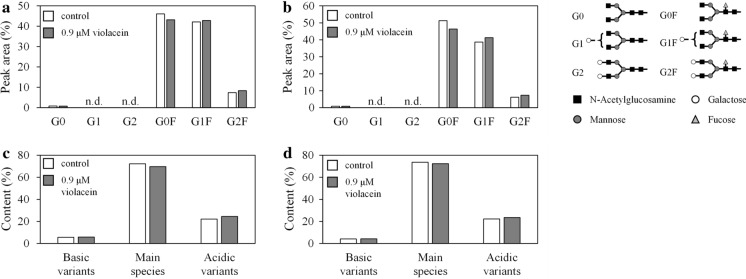
Fig. 5.
Effect of violacein on N-linked glycosylation and charge variant distribution. N-linked glycosylation profiles of IgG obtained from batch culture with or without 0.9 μM violacein on a day 4 and b day 7. Charge variation profiles of IgG obtained from batch culture with or without 0.9 μM violacein on c day 4 and d day 7. The data were obtained from a single experiment. n.d. not detected, IgG immunoglobulin G

