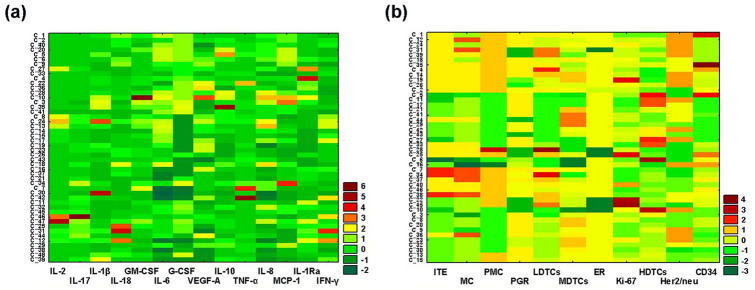
Figure 1.
Graphical representation of the results of two-way joining cluster analysis of the data on cytokine production by IC-NST samples and IC-NST histopathological parameters. (a) The horizontal axis of the graph shows the cytokines involved in the classification (according to their production by IC-NST samples, pg/ml), and the vertical axis indicates the encrypted numbers of IC-NST samples from different patients. (b) The graph shows horizontally the histopathological parameters involved in IC-NST classification, and vertically the encrypted numbers of IC–NST samples from different patients. The colors of the intersecting cells indicate that the matrix elements belong to a specific cluster. The color gradient from green to red respectively denotes an indicator’s value below or above the average.

