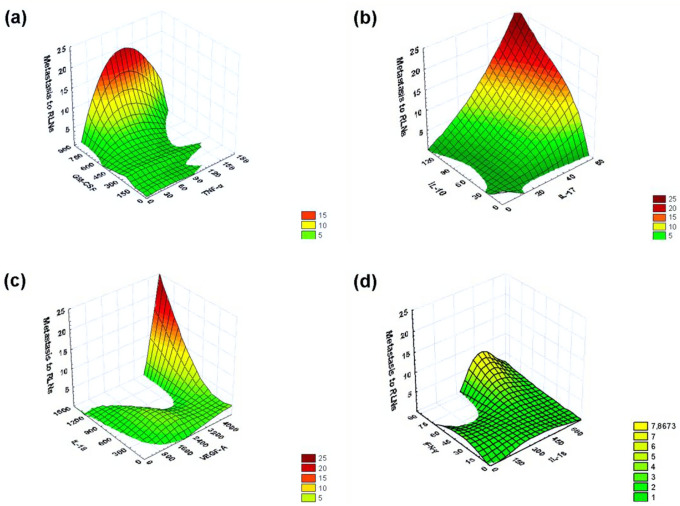
Figure 3.
The 3D Surface Plot (Negative Exponential Smoothing), a 3D distribution surface was constructed, which characterizes the dependence of the number of detected RLNs with metastases on concentrations of various pairs of cytokines (pg/ml) produced by IC-NST samples. (a) The dependence of the number of detected RLNs with metastases on concentrations of TNF-α and GM-CSF produced by IC-NST samples. (b) The dependence of the number of detected RLNs with metastases on concentrations of IL-10 and IL-17 produced by IC-NST samples. (c) The dependence of the number of detected RLNs with metastases on concentrations of IL-18 and VEGF-A produced by IC-NST samples. (d) The dependence of the number of detected RLNs with metastases on concentrations of IL-18 and IFN-γ produced by IC-NST samples.

