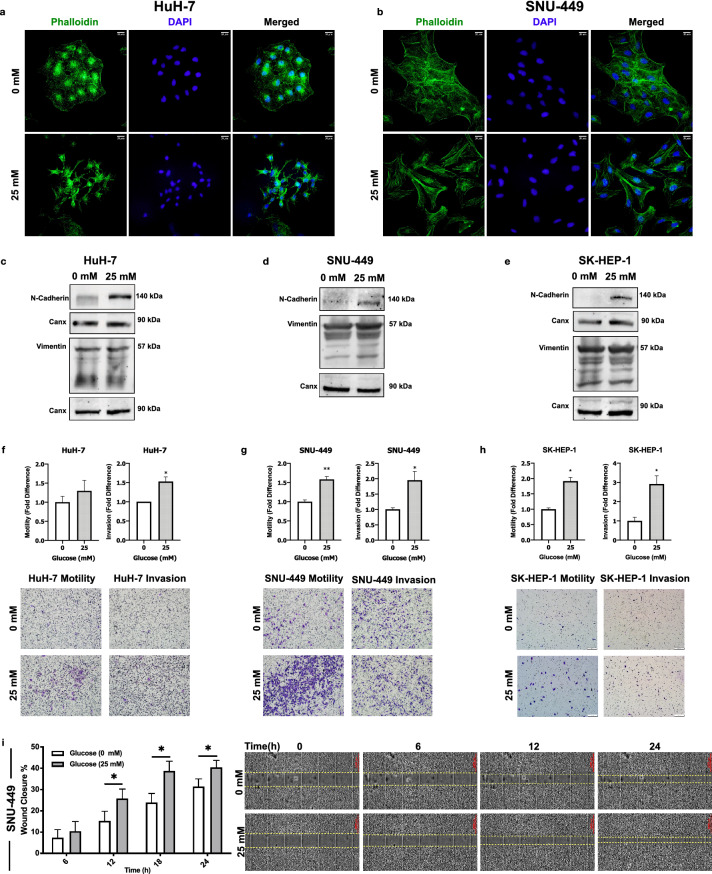
Figure 1.
High glucose promoted mesenchymal phenotype and induced motility and invasion in HCC cell lines. Immunofluorescence imaging of Alexa-488-conjugated Phalloidin labeling of F-actin stress fibrils in (a) HuH-7 and (b) SNU-449 cells in no- and high-glucose (25 mM) supplemented culture conditions. Immunoblotting of cell cytoskeleton EMT biomarkers N-cadherin and Vimentin expressions in (c) HuH-7, (d) SNU-449 and (e) SK-HEP-1 cells. Graphical presentation of fold difference in motility and invasion of (f) HuH-7, (g) SNU-449 and (h) SK-HEP-1 cells cultured in no- and high-glucose supplemented media analyzed by trans-well motility and invasion assays. Graphical presentation of (i, left) wound closure percentage of SNU-449 cells after 6-, 12-, 18- and 24-h incubation in no- and high-glucose supplemented culture conditions. Wound-healing graphical presentation represents 3 independent experiments. Combined microscopic images of (i, right) SNU-449 wound healing assay from automated microscope for real-time live cell imaging on 0, 6th, 12th and 24th hours. Full length blots are presented in Supplementary. All graphs of experiments are presented as the mean ± SEM of at least 3 independent experiments. Statistical analyses were performed and column graphs were generated using GraphPad Prism version 8.2.1 for MacOS, GraphPad Software, San Diego, California USA, https://www.graphpad.com .* p ≤ 0.05, ** p ≤ 0.01, *** p ≤ 0.001, **** p ≤ 0.0001.

