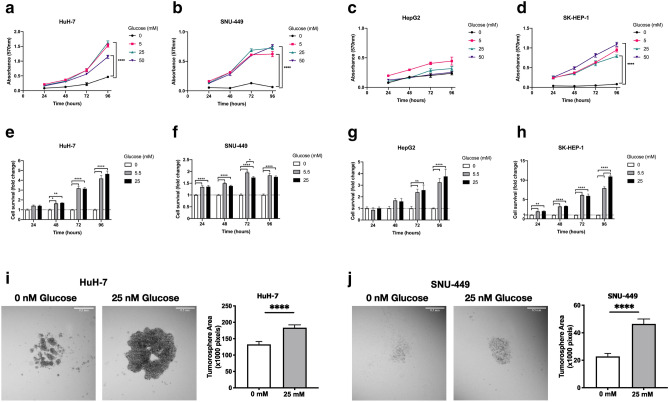
Figure 2.
High glucose did not induce glucose toxicity but enhanced spheroid formation in HCC cells. Analysis of toxicity of (a) HuH-7, (b) SNU-449, (c) HepG2 and (d) SK-HEP-1 cells in response to increasing glucose concentrations (0, 5, 25, 50 mM) with MTT assay. Cell survival is represented as absorbance (570 nm). Analyses of cell survival differences of (e) HuH-7, (f) SNU-449, (g) HepG2 and (h) SK-HEP-1 cells in no-, normo- (5.5 mM) and hyperglycemic-glucose (25 mM) conditions by SRB. Brightfield images and graphical presentation of hanging-drop spheroid formation assay performed with (i) HuH-7 and (j) SNU-449 cells in no- and high-glucose (25 mM glucose) supplemented conditions. Spheroid area is calculated with ImageJ. All graphs of experiments are presented as the mean ± SEM of at least 3 independent experiments. Statistical analyses were performed and graphs were generated using GraphPad Prism version 8.2.1 for MacOS, GraphPad Software, San Diego, California USA, https://www.graphpad.com. * p ≤ 0.05, ** p ≤ 0.01, *** p ≤ 0.001, **** p ≤ 0.0001.

