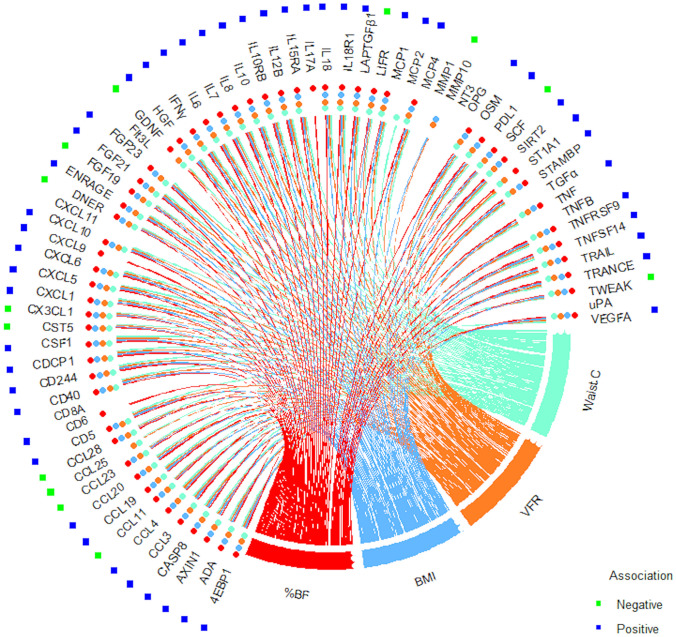
Figure 2.
Associations between body composition measurements and protein levels. Statistically significant (i.e. nominal p-value < 0.05 at < 0.05 FDR) negative (green dot) and positive (blue dot) association with %BF (red line and dot), BMI (light blue line and dot), VFR (orange line and dot), and waist circumference (light green line and dot) are shown in circos plot based on results from linear regression models of %BF, BMI, VFR and waist circumference respectively. Adjusted for sex, smoking, e-cigarette use, snuff use, and age at sampling.

