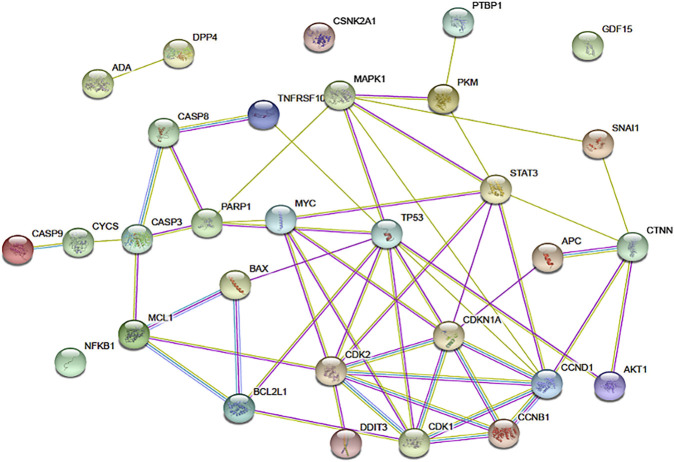
FIGURE 3.
The network of connections between regulatory pathways and molecules that are known to be impacted by apigenin. The functional protein association tool STRING was used to map the inter-connectedness of impacted proteins, identified through physical protein interactions in Homo sapiens, as shown. Connections between nodes are color coded depending on the interaction type: blue, curated databases; fuchsia, experimentally determined; green, textmining; light purple, protein homology. Connections within this network for DPP4, ADA, CSNK2A1, and CDF15 are not shown, but published data on non-physical interactions (e.g., gene co-expression) indicate that such links exist.

