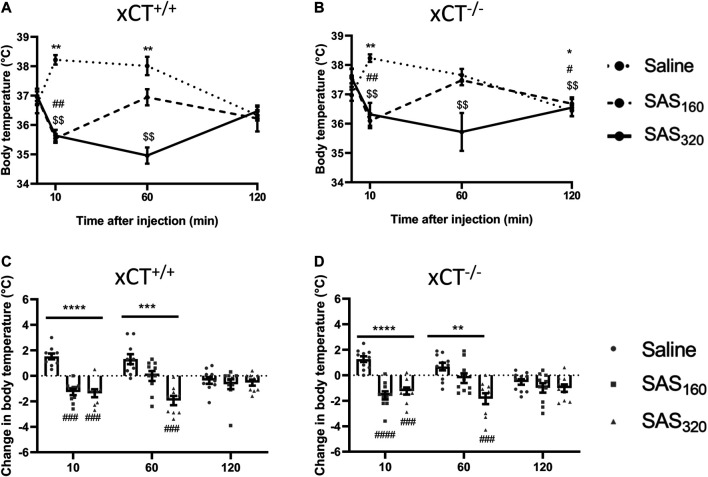
FIGURE 4.
The effect of chronic sulfasalazine (SAS) treatment on changes in body temperature after injection. After four weeks of treatment, body temperature was measured 10, 60 and 120 min after SAS injection and plotted as absolute values (A,B) or as the difference compared to the body temperature before injection (C,D) (n = 9–10 x CT+/+ mice/group (A,C); n = 10–11 xCT−/− mice/group (B,D)). Data are presented as mean ± SEM and analyzed using a Wilcoxon matched-pairs signed rank test for each treatment paradigm at the different timepoints compared to baseline (A–B): saline: *p < 0.05, **p < 0.01; SAS160: # p < 0.05, ## p < 0.01; SAS320: $$ p < 0.01. A Kruskal-Wallis test (C-D; **p < 0.01, ***p < 0.001, ****p < 0.0001) followed by Dunn’s multiple comparison was used to compare each dose of SAS to saline on each timepoint (### p < 0.001, #### p < 0.0001).

