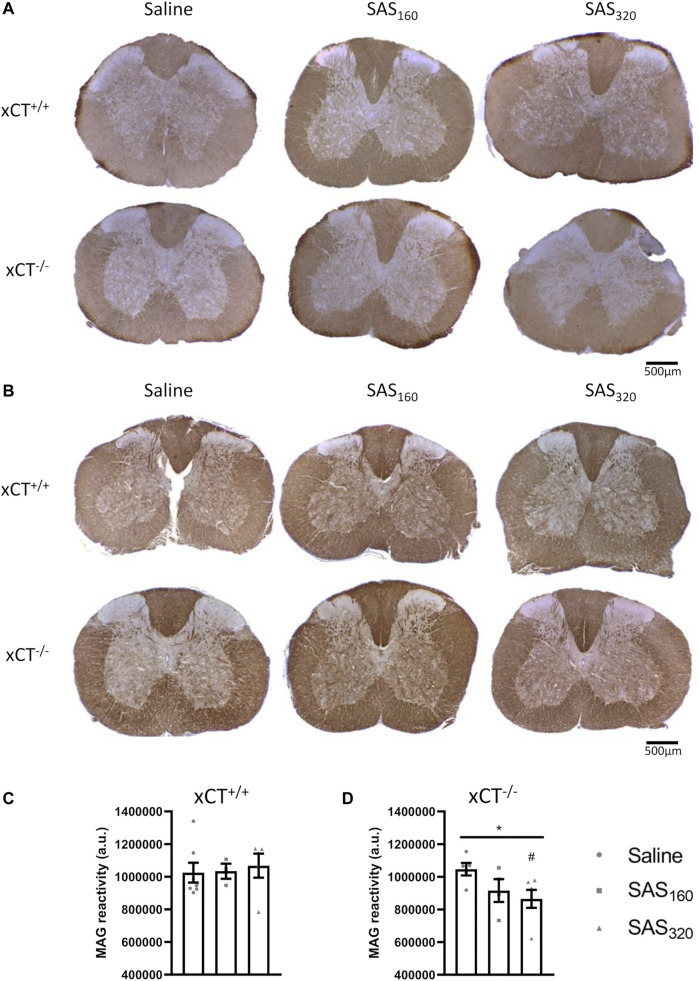
FIGURE 8.
Effects of chronic sulfasalazine (SAS) treatment on myelin in the spinal cord. Representative photomicrographs of myelin basic protein (MBP) (A) and myelin-associated glycoprotein (MAG) immunostaining (B) as well as quantification of the MAG staining (C,D). One slice of n = 3–7 mice/group was used, data are presented as mean ± SEM and analyzed using a Kruskal-Wallis test (*p < 0.05) followed by Dunn’s multiple comparisons for each dose of SAS compared to saline (# p < 0.05).

