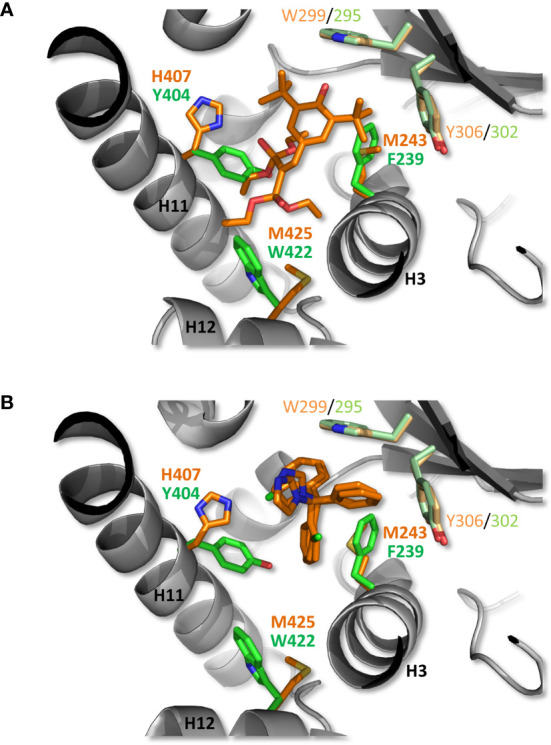
Figure 5.

Structural analysis of zfPXR selectivity. A zfPXR LBD model was generated and superimposed on the crystallographic structures of hPXR LBD in complex with the reference agonist SR12813 (A) and clotrimazole (B). The ligands and side chains of hPXR residues are shown as orange sticks, while zfPXR residues are colored in green. The conserved π-trap residues in hPXR (W299, Y306) and zfPXR (W295, Y302) are displayed in light orange and light green, respectively. For clarity, only residue differences at key positions are shown.
