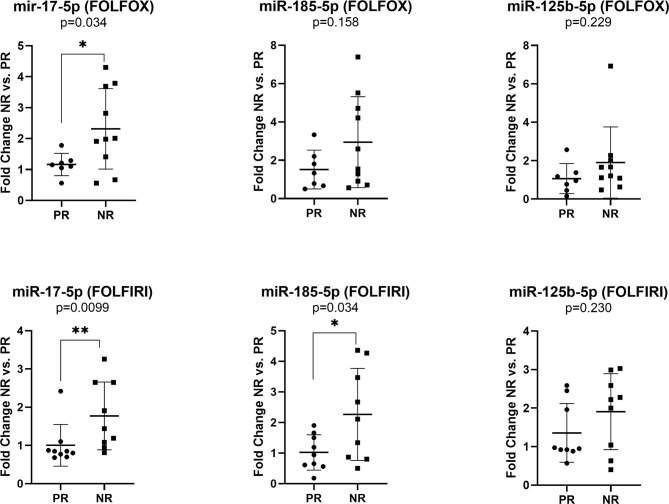
Figure 4.
Expression of miR-17-5p, miR-185-5p, and miR-125b-5p in the plasma exosomes of non-responders versus responder colorectal cancer patients for FOLFOX4 (n=10/7) and FOLFIRI (n=9/9) therapy. According to data distribution, differential expression was tested using the non-parametric Mann-Whitney U test (miR-17-5p and miR-125b-5p) or parametric unpaired t-test (miR-185-5p). Fold change for each sample was calculated relative to PR group *p≤0.05; **p≤0.01.

