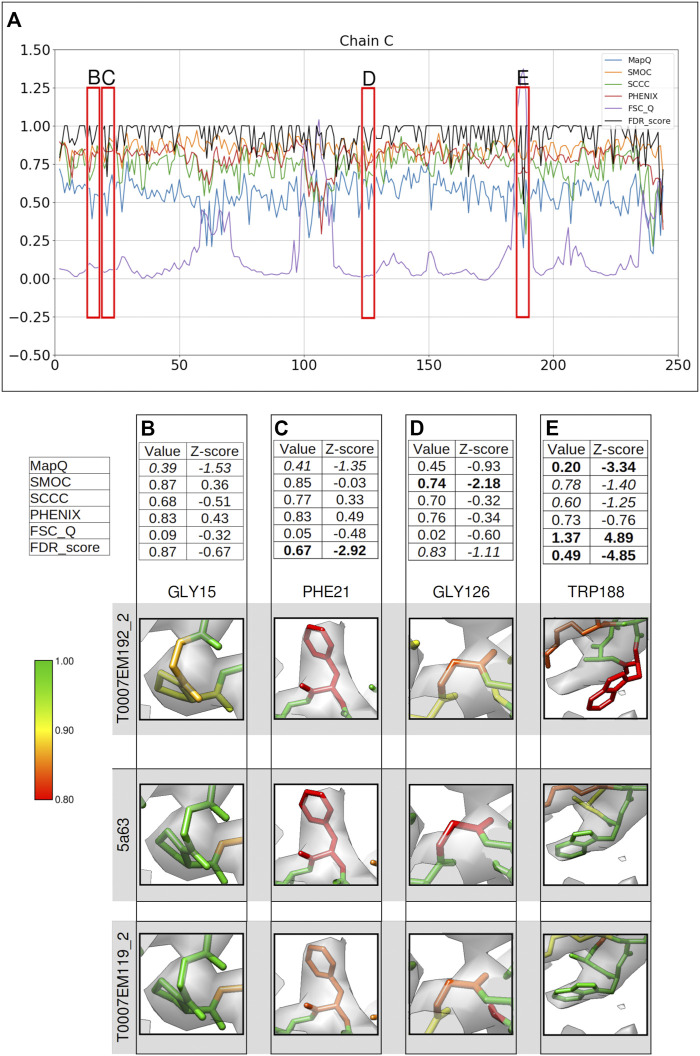
FIGURE 4.
Comparison of metrics for the atomic model of γ-secretase, calculated only for the backbone atoms. (A) Comparison of per-residue scores from MapQ, SMOC, SCCC, PHENIX, FSC-Q, and FDR backbone score for the chain C of the atomic model T0007EM192_2 from the EMDB model challenge; the red boxes highlight the residues selected for detailed analysis in the panels below. For Gly 15 (B), Phe 21 (C), Gly 126 (D), and Trp 188 (E), the panel shows a table with values of scores obtained with each metric and corresponding Z-scores; the residue fit in the target map (EMD-3061, grey) displayed at the recommended contour level and rendered in UCSF Chimera (first row); the residue fit in map as modeled in the reference (PDB ID: 5a63, center), and the fit of model T0007EM119_2 in the map (last row).

