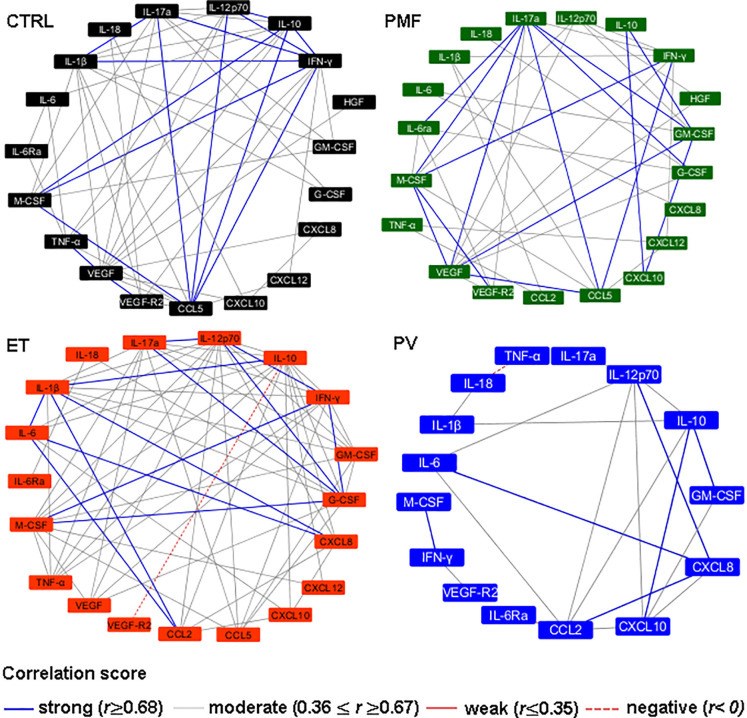
Figure 2.
Soluble mediators interaction networks in healthy subjects (CTRL, n = 17) and patients with essential thrombocythemia (ET, n = 28), polycythemia vera (PV, n = 19), and primary myelofibrosis (PMF, n = 16). The correlations were stratified according to r-values: strong (blue lines, r ≥0.68), moderate (gray lines, 0.36 ≤ r ≥ 0.67) and negative (dashed red line, r <0). The correlations depicted in this figure were significant (p <0.05).

