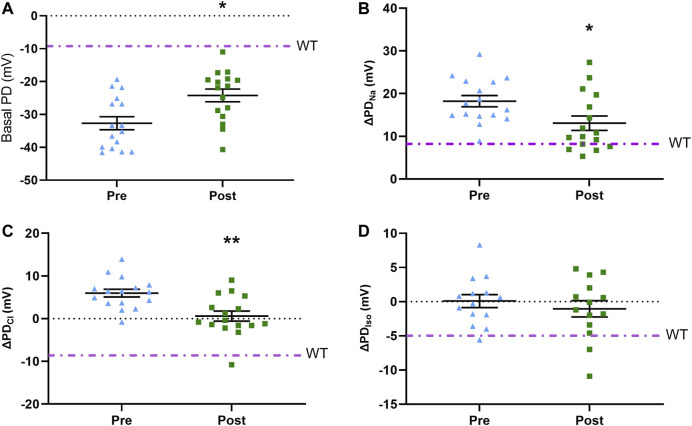
FIGURE 3.
Pre-treatment and post-treatment nasal PD results following LV-V5-CFTR vector delivery to nasal epithelium of CF KO rats. Nasal PD measurements in CF KO rats for (A) basal KRB (B) ΔPDNa (C) ΔPDCl, and (D) ΔPDIso. Dot/dash line indicates the WT average (*p ≤ 0.05, **p ≤ 0.01, paired t-test; n = 14–16). Data represented as the mean with −/+ SEM.

