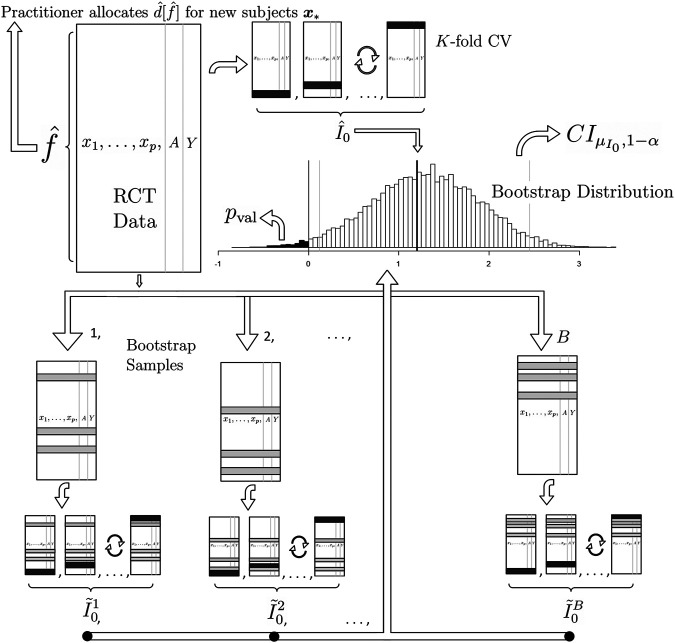
FIGURE 1.
A graphical illustration of (1) our proposed method for estimation and (2) our proposed method for inference on the population mean improvement of an allocation procedure and (3) our proposed future allocation procedure (top left of the illustration). To compute the best estimate of the improvement , the RCT data goes through the K-fold cross validation procedure of Section 3.4 (depicted in the top center). The black slices of the data frame represent the test data. To draw inference, we employ the non-parametric bootstrap procedure of Section 3.5 by sampling the RCT data with replacement and repeating the K-fold CV to produce (bottom). The gray slices of the data frame represent the duplicate rows in the original data due to sampling with replacement. The confidence interval and significance of is computed from the bootstrap distribution (middle center). Finally, the practitioner receives which is built with the complete RCT data (top left).

