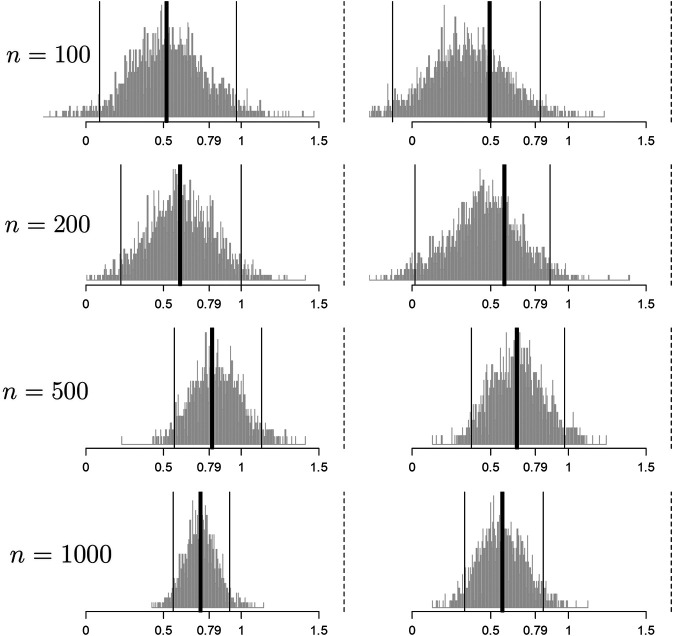
FIGURE 3.
Histograms of the bootstrap samples of the cross-validated improvement measures for random (left column) and best (right column) for the response model of Eq. 12 for different values of n. is illustrated with a thick black line. The computed via the percentile method is illustrated by thin black lines. The true population improvement given the optimal rule is illustrated with a dotted black line.

