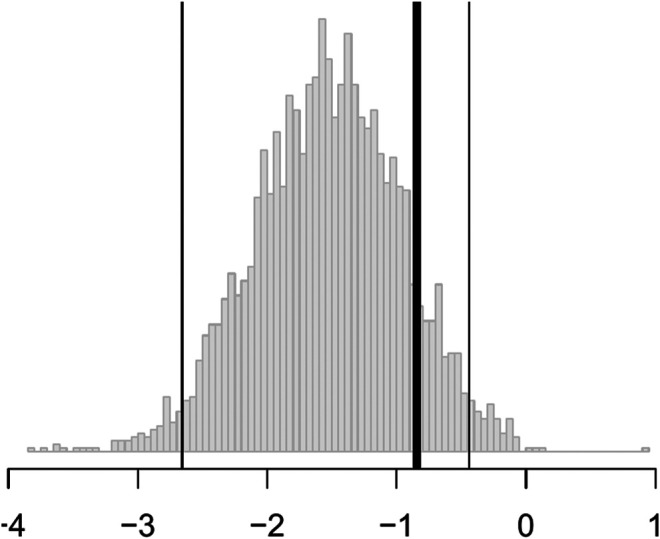
FIGURE 4.

Histograms of the bootstrap samples of i.e. for the random business-as-usual allocation procedure. The thick black line is the best estimate of , the thin black lines are the confidence interval computed via the percentile method. More negative values are “better” as improvement is defined as lowering the HSRD composite score corresponding to a patient being less depressed.
