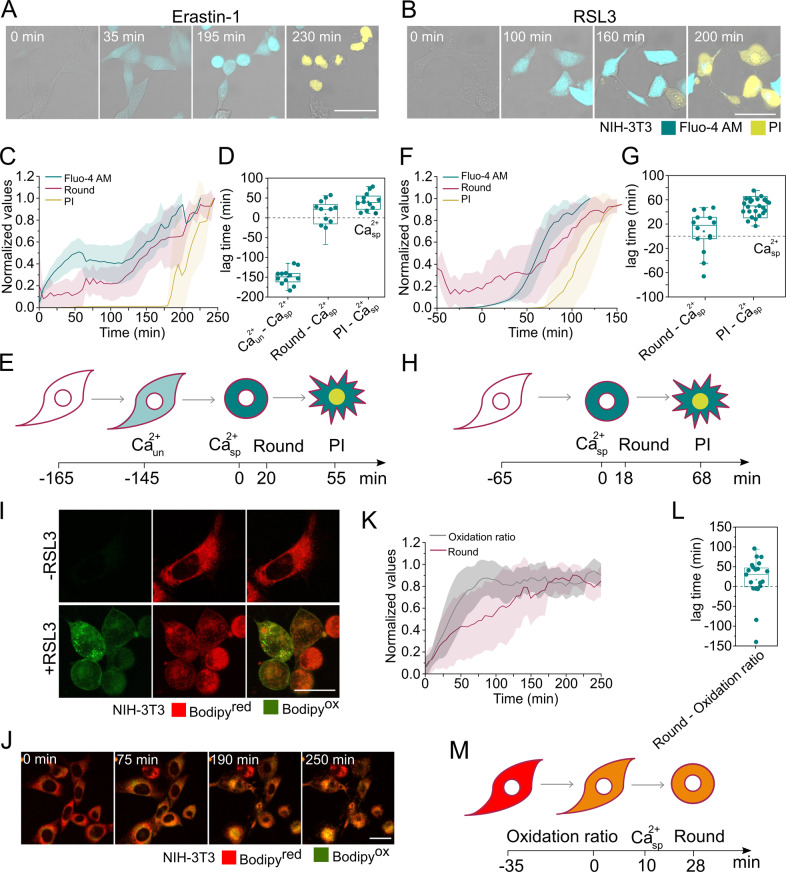
Fig. 2. Increase in cytosolic Ca2+ and lipid oxidation take place prior to plasma membrane breakdown.
Time-lapse images of NIH-3T3 cells treated with A Erastin-1 or B RSL3, and monitored for cell rounding and Fluo-4 AM and PI staining. Scale bar, 50 µm. C Kinetics of increase of the normalized Fluo-4 AM signal, cell rounding, and PI intake upon Erastin-1 treatment. Interval time between measurements was 5 min. Plots show the average (N = 16 cells) temporal relationships between the normalized parameters. All cells were synchronized to the first appearance of specific Ca2+ signal (t = 0). D Time delay between a specific Ca2+ flux and other ferroptotic events (unrelated Ca2+, change in cell rounding and PI) observed upon Erastin-1 treatment. E Graphical representation of the sequence of events observed during Erastin-1-induced ferroptosis. F Kinetics of increase of the normalized Fluo-4 AM signal, change cell rounding, and PI intake upon RSL3 treatment. Plots show the average (N = 25 cells) temporal relationships between the normalized parameters. All cells were synchronized to the first appearance of specific Ca2+ signal (t = 0). G Time delay between specific Ca2+ flux and other ferroptotic events (change in shape and PI) observed upon RSL3 treatment. Interval time between measurements was 5 min. H Graphical representation of the sequence of events observed during RSL3-induced ferroptosis. I Live cells confocal imaging of NIH-3T3 cells labeled with BODIPY before and after 2 h of treatment with RSL3. Pictures are representative of at least three independent confocal microscopy experiments. J Time-lapse images of lipid peroxidation in NIH-3T3 cells upon treatment with RSL3. Scale bar, 25 µm. K Time course of the increase of the normalized oxidation ratio and change in cell rounding upon RSL3 treatment. Plots show the average (n = 21 cells) temporal relationships between the normalized parameters. All cells were synchronized to the increase in the Oxidation ratio (t = 0). L) Time delay between cell round and oxidation ratio observed upon RSL3 treatment. M Graphical representation of the sequence of the lag time observed between oxidation ratio and other ferroptotic events during RSL3-induced ferroptosis. In C, F, and K, values were normalized between 0 and 1. In D, G, and L, t50 of each event was calculated from individual curves obtained per single cells. These values correspond to the time at 50% of the maximum signal. Concentrations: Erastin-1 (10 µM) and RSL3 (2 µM).

