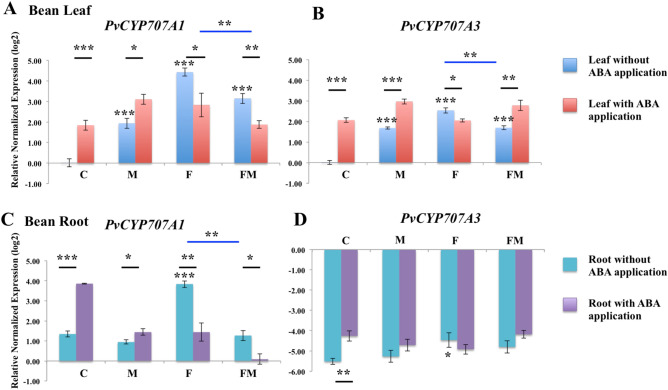
Figure 3.
Relative expression of genes involved in the ABA catabolic pathway in bean leaves (A, B) and roots (C, D). RNA was extracted at 14 days bean leaves and root in un-inoculated control (C), colonized by M. robertsii (M), F. solani (F), and M. robertsii together with F. solani (FM). For each gene, the expression level in un-inoculated control bean leaf was set to 1. Standard errors are shown. Data were analyzed with standard t-test in Bio-Rad CFX Manager software. Statistical differences are shown; *P < 0.05, **P < 0.01, ***P < 0.001. Asterisk alone indicates significant differences in gene expression in the tested group when compared to that of the un-inoculated control. Asterisk above the black line indicates significant differences in gene expression in the plant with exogenous ABA application compared to the corresponding plant without ABA application. Asterisk above blue line indicates significant difference in gene expression in the plant co-colonized by M. robertsii and F. solani compared to that in the plant colonized only by F. solani or M. robertsii. ABA 8′-hydroxylase 707A1 (PvCYP707A1) and ABA 8’-hydroxylase 707A3 (PvCYP707A3). The experiment was repeated twice with similar results.

