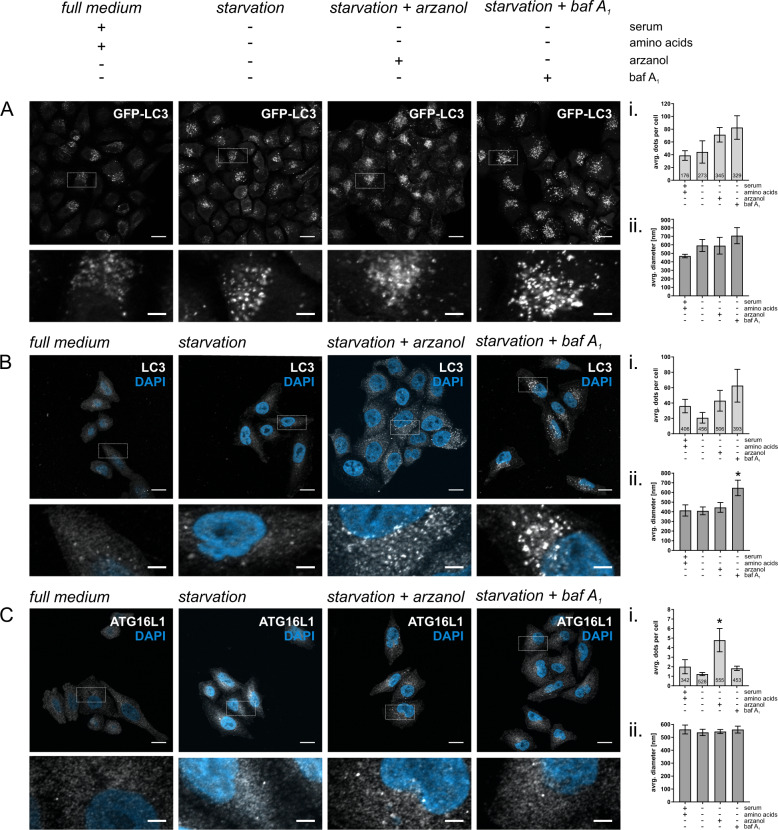
Fig. 3. Arzanol interferes with autophagosome elongation.
Shown are representative microscopy images of HeLa cells stably expressing GFP-LC3-RFP-LC3ΔG (A), or wild-type HeLa cells immunofluorescently labeled for endogenous LC3 (B) or ATG16L1 (C). All cells were starved in serum- and amino acid-free medium for 2 h while incubated with 3 µM arzanol or 10 nM bafilomycin A1. Scale bars in upper panels are 15.5 µm, scale bars in magnifications are 3.875 µm. (i) Data show the average number of dots per cell from biological triplicates for GFP-LC3, and n = 6 for LC3 and ATG16L1 as mean ± SEM. Digits in bars show the total number of cells quantified using ImageJ software. (ii) Data show the average diameter of dots in nm as mean ± SEM. Statistical analysis was performed using ordinary one-way ANOVA with Tukey’s multiple comparison test, *P < 0.1.

