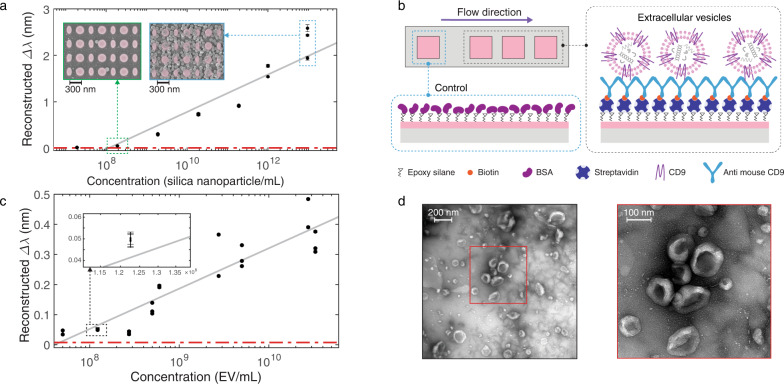
Fig. 4. Biosensing using reconstructed spectral shift based on aided imaging method.
a The reconstructed spectral shift (Δλ) calibration curve of biotinylated silica nanoparticles (100 nm diameter). The insets are scanning electron microscopy images of the sensors with bound silica nanoparticles on resonators after introducing suspensions with 1.9 × 10⁸ nanoparticles/mL and 9.5 × 10¹² nanoparticles/mL from left to right, respectively. The represented data points in the calibration curves (a, c) are the mean Δλ over time from each sensor over a time-interval consisting of 81 consecutive images after the analyte binding reaches the equilibrium state, and the error bars indicate the standard deviations. The reconstructed Δλ data points are obtained from seven dilutions of silica nanoparticle solutions over three independent sensors to achieve 21 data points on the calibration curve. The reconstructed Δλ data from the detection sensors are corrected to the non-specific bindings on the control sensor. Some data points are overlapped due to the good agreement between the sensor performance. b Biorecognition assay to detect extracellular vesicles (EVs) on the detection sensors and on the control sensor blocked with bovine serum albumin (BSA) to account for non-specific binding is shown on top. c The reconstructed spectral shift calibration curve of EVs. The inset is the same plot with a magnified x-axis to better resolve the small error bars for an exemplary data point. The reconstructed shift data points from the detection sensors are corrected to the non-specific bindings on the control sensor. The represented data points are collected from nine different concentrations of EV solutions diluted from three independent batches measured on eight independent sensors to yield 24 data points on the calibration curve. Some data points are overlapped due to the good agreement between the sensors. d Transmission electron microscopy images of EVs from the cell culture supernatant of 4T1 mouse breast cancer cells can be seen at the bottom; the magnifications are ×23,000 and ×30,000 from left to right, respectively.

