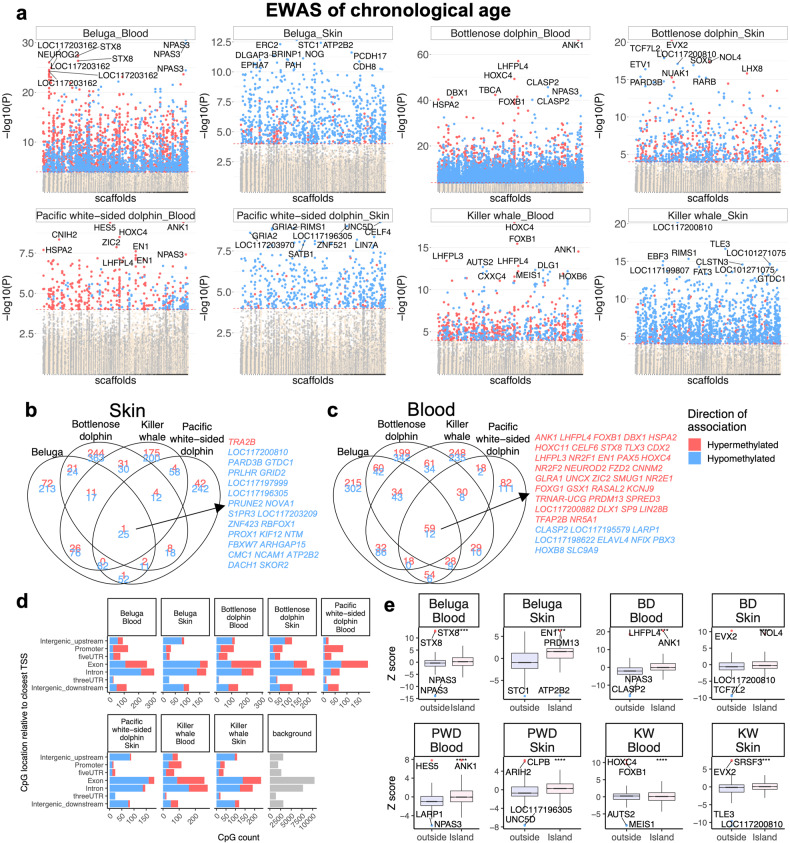
Fig. 3. Epigenome-wide association (EWAS) of chronological age in skin and blood of four Odontoceti species.
a Manhattan plots of the EWAS of chronological age. The coordinates are estimated based on the alignment of Mammalian array probes to killer whale (GCF_000331955.2_Oorc_1.1) genome assembly. The direction of associations with P < 0.0001 (red dotted line) is highlighted by red (hypermethylated) and blue (hypomethylated) colors. Top 10 CpGs were labeled by the neighboring genes. Venn diagrams representing the overlap of aging-associated CpGs in skin (b) and blood (c) of these species. The conserved DNAm aging loci in blood and skin samples were marked by neighboring gene symbol. This analysis was limited to top CpGs that were selected at P < 0.0001 and further filtering based on z score of association with chronological age for up to 500 in a positive or negative direction. The number of selected CpGs: beluga blood, 1000; beluga skin, 639; bottlenose dolphin blood, 1000; bottlenose dolphin skin, 68; Pacific white-sided dolphin blood, 490; Pacific white-sided dolphin skin, 564; killer whale blood, 935; killer whale skin, 665. d Location of top CpGs in each species relative to the closest transcriptional start site. e Box plot represents 25th and 75th percent quartiles, the line represents the median, and whiskers are 90% of aging association stratified by CpG island status in killer whale genome. *p < 0.05, **p < 0.01, ***p < 0.001, ****p < 0.0001.

