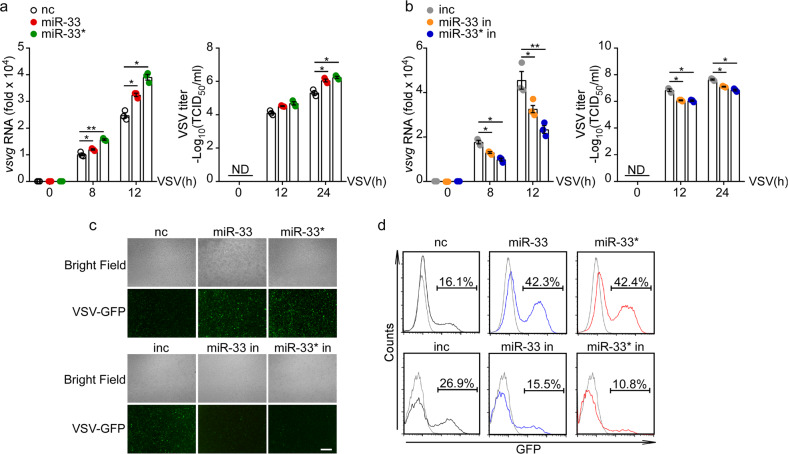
Fig. 2.
miR-33/33* promote VSV infection in macrophages. a and b qRT-PCR analysis of VSV transcripts and TCID50 determination of VSV loads in macrophages transfected with the negative control mimics (nc), miR-33 mimics (miR-33), miR-33* mimics (miR-33*) a, or negative control inhibitor (inc), miR-33 inhibitor (miR-33 in) or miR-33* inhibitor (miR-33* in) b followed by infection for the indicated time with VSV (MOI = 1). c Immunofluorescence assay of VSV-GFP in macrophages transfected with nc, miR-33, miR-33* or inc, miR-33 in, miR-33* in, followed by infection for 12 h with GFP-expressing VSV (MOI = 1 for nc/miR-33/33* mimics; MOI = 2 for inc/miR-33/33* inhibitors). Scale bars, 100 µm. d Flow cytometry analysis of GFP fluorescence intensity in macrophages treated as in c. ND, not detectable; vsvg, glycoprotein of VSV Indiana serotype. *p < 0.05; **p < 0.01 (one-way ANOVA a, b). Data are presented as the mean ± s.e.m. and are representative of three independent experiments.

