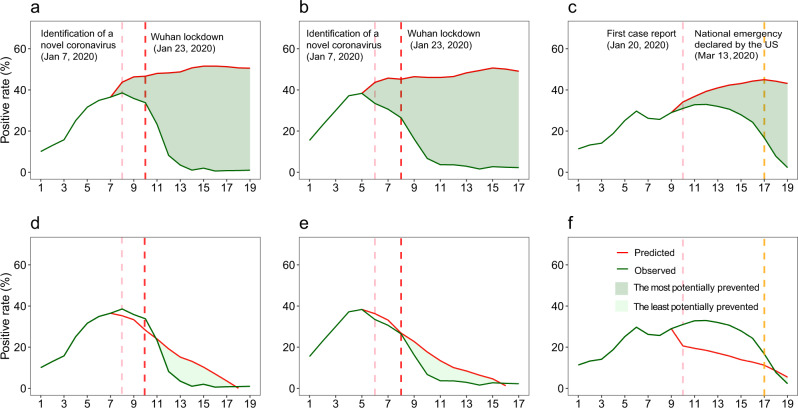
Fig. 3. Potential impact of COVID-19 outbreaks and interventions on seasonal influenza intensities in mainland China and the US, 2019–2020.
a–c Comparisons of observed influenza activities with the upper bounds predicted with 2011–2019 expectations under a counterfactual scenario of no COVID-19 outbreaks and related interventions in Southern China (a), Northern China (b), and the US (c). d–f Comparisons of observed influenza activities with the upper bounds of estimates under the counterfactual scenario in Southern China (d), Northern China (e), and the US (f). The pink vertical dashed lines indicate when China identified SARS-CoV-2 and the US first reported cases of COVID-19. The red vertical dashed lines indicate the start of the lockdown in Wuhan, January 23, 2020. The orange vertical dashed lines indicate the declaration of a national emergency by the US on March 13, 2020. Potentially prevented in influenza activity = (area under the predicted epidemic curve without COVID-19 outbreaks and NPIs − area under the observed epidemic curve)/area under the predicted epidemic curve without COVID-19 outbreaks and NPIs × 100%.

