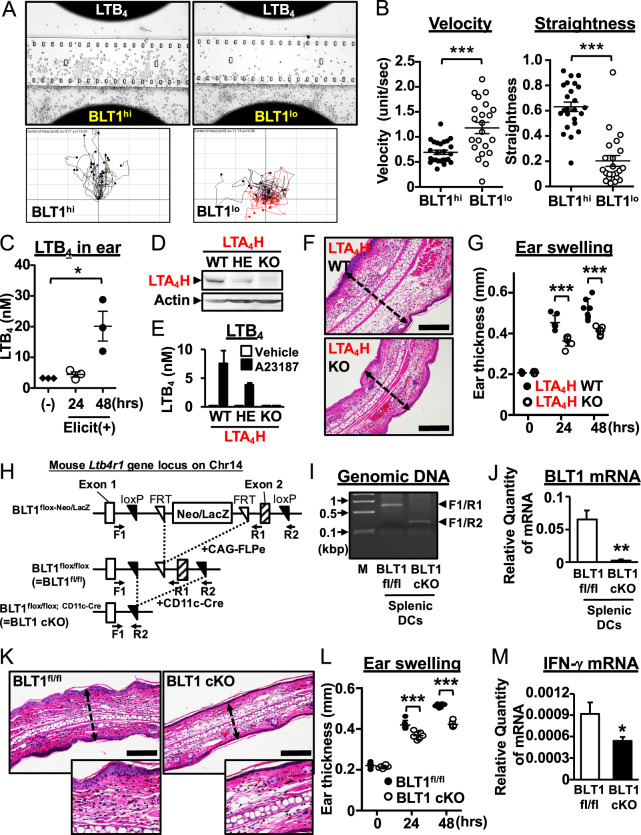
Fig. 2.
BLT1hi DCs migrate toward LTB4 and accelerate dermatitis. a, b A chemotaxis assay was used to assess the migration of BLT1hi DCs (left) and BLT1lo DCs (right) derived from BMDCs toward LTB4. Cells were placed in the bottom chamber, and 100 nM LTB4 was added to the head chamber. Representative images are shown (a, upper panels). Tracking charts for each cell type are shown (n > 20). Black tracking lines indicate the cells moving forward, and red tracking lines indicate the cells moving backward (a, bottom panels). Velocity and straightness are shown in b (n > 20; error bars indicate the S.E.M.). c The fatty acid-enriched fraction from mouse ears was analyzed for LTB4 by LC-MS/MS. The time after elicitation is shown. (−): no elicitation. d Western blot analysis for the LTA4H protein was performed with BMDC protein lysates (WT wild-type, HE heterozygous, KO homozygous knockout). e The A23187 (calcium ionophore)-dependent production of LTB4 by BMDCs was analyzed by LC-MS/MS. WT wild-type, HE hetero, KO knockout. f H&E-stained ear sections from LTA4H WT and LTA4H KO mice are shown. Bars, 100 μm. Dotted lines indicate ear thickness. g Ear thickness was measured at 0, 24, and 48 h after elicitation in WT and LTA4H KO mice (n = 7). h The schematic shows the mouse ltb4r1 gene locus targeted to generate DC-conditional BLT1 knockout mice. i Genotyping was performed to evaluate the deletion of the targeted loci. The primer position is indicated in h. j The expression of BLT1 in splenic DCs was evaluated. k, l, m BLT1fl/fl and BLT1 DC cKO mice were sensitized and challenged with the hapten DNFB. k H&E-stained ear sections from hapten-induced BLT1fl/fl (left panels) and BLT1 DC cKO mice (right panels) are shown. Forty-eight hours after challenge, ear tissue was collected and stained. Bars, 100 μm. l Ear thickness was measured at 0, 24, and 48 h postelicitation in WT and BLT1 DC cKO mice (n = 6). m The mRNA expression of IFN-γ in ear tissue at 48 h postelicitation was measured by QPCR. β-actin was used as an internal control. *P < 0.05; ***P < 0.001; unpaired Student’s t-test (b, j, m); two-way ANOVA with Bonferroni’s post hoc tests (c, g, l)

