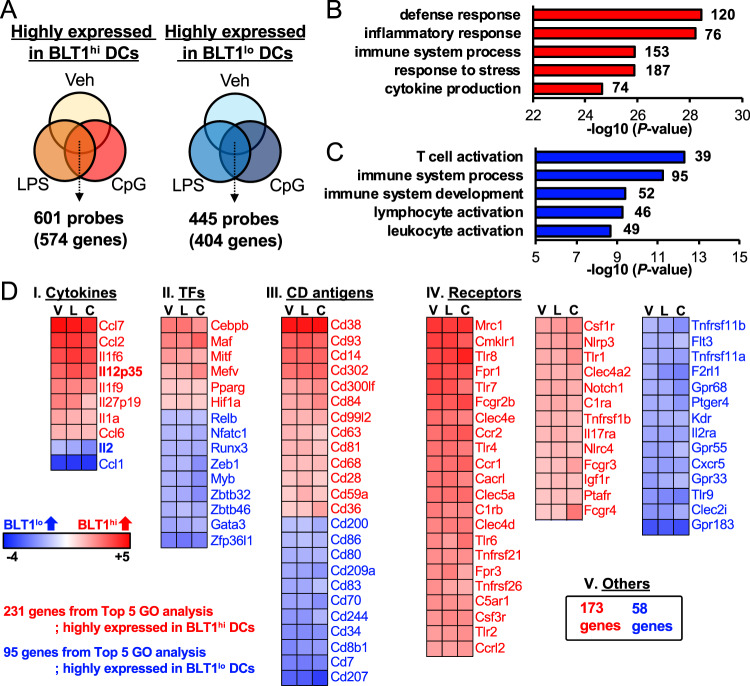
Fig. 4.
Comparative transcriptomic analysis of BLT1hi and BLT1lo DCs. a Venn diagrams show genes highly expressed in BLT1hi DCs (left) and BLT1lo DCs (right) under various conditions (exposure to LPS [100 ng/ml] and CpG DNA [1 μM] treatment for 4 h). Gene Ontology (GO) analysis was performed on 574 genes highly expressed in BLT1hi DCs (b) and on 404 genes highly expressed in BLT1lo DCs (c). The top 5 GO terms are listed. The numbers indicate the number of genes categorized in that GO term (574 genes (b) or 404 genes (c)). d The 231 genes listed in the top 5 GO terms for BLT1hi DCs and the 95 genes listed in the top 5 GO terms for BLT1lo DCs were categorized as follows: cytokines, transcription factors (TFs), CD antigens, receptors, and other. A heat map is shown. V, vehicle-treated group; L, LPS-treated group; C, CpG DNA-treated group

