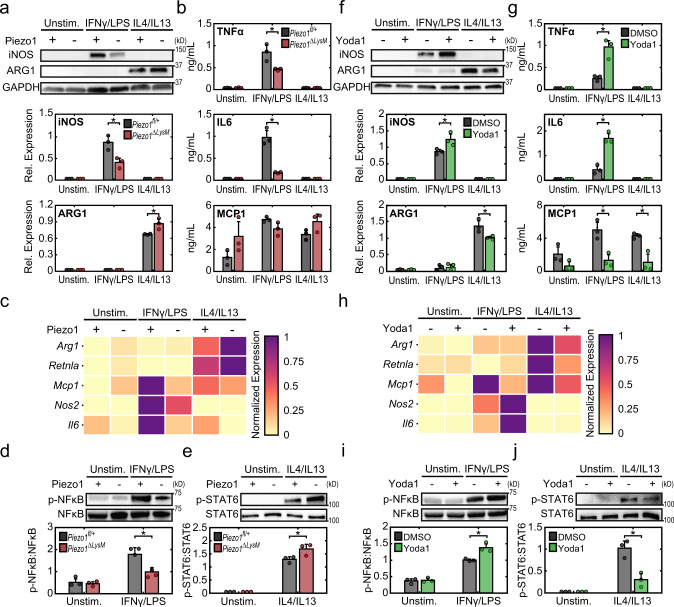
Fig. 1. Piezo1 regulates cytokine-induced macrophage activation.
a Representative Western blots (top) and quantification (bottom) of iNOS, ARG1, and GAPDH of Piezo1fl/+ and Piezo1ΔLysM BMDMs incubated with media (Unstim.), IFNγ/LPS (0.3 ng/mL of each), or IL4/IL13 (0.1 ng/mL of each). b TNFα, IL6, and MCP1 secretion from Piezo1fl/+ and Piezo1ΔLysM BMDMs incubated with the indicated conditions, as measured by ELISA. c Relative gene expression of inflammatory and healing markers in Piezo1fl/+ and Piezo1ΔLysM BMDMs incubated with the indicated conditions, as measured by qPCR. Gene expression is shown relative to the highest expressing condition. d, e Representative Western blots (top) and quantification (bottom) of p-NFκB/NFκB of Piezo1fl/+ and Piezo1ΔLysM BMDMs incubated with media (Unstim.) or IFNγ/LPS for 1 h (d) and p-STAT6/STAT6 of Piezo1fl/+ and Piezo1ΔLysM BMDMs incubated with media (Unstim.) or IL4/IL13 for a period of 1 h (e). f Representative Western blots (top) and quantification (bottom) of iNOS, ARG1, and GAPDH of BMDMs exposed to DMSO or 5 µM Yoda1 and stimulated with media (Unstim.), IFNγ/LPS (0.3 ng/mL of each), or IL4/IL13 (0.1 ng/mL of each). g TNFα, IL6, and MCP1 secretion from BMDMs exposed to DMSO or 5 µM Yoda1 and incubated in the indicated conditions, as measured by ELISA. h Relative gene expression of inflammatory and healing markers of BMDMs exposed to DMSO or 5 µM Yoda1 incubated in the indicated conditions, as measured by qPCR. Gene expression is shown relative to the highest expressing condition. i–j Representative Western blots (top) and quantification (bottom) of p-NFκB/NFκB of wild-type BMDMs exposed to DMSO or Yoda1 and stimulated with media (Unstim.) or IFNγ/LPS for 2 h (d) and p-STAT6/STAT6 of Piezo1fl/+ and Piezo1ΔLysM BMDMs incubated with media (Unstim.) or IL4/IL13 for a period of 1 h. Error bars denote Mean ± SD for three independent experiments, * p < 0.05 as determined by two-tailed Student’s t test. Phosphorylated and total forms of transcription factors were obtained from loading equal amounts of protein in separate gels and the resulting blots were processed in parallel. Source data including exact p-values are provided as a Source Data file.

