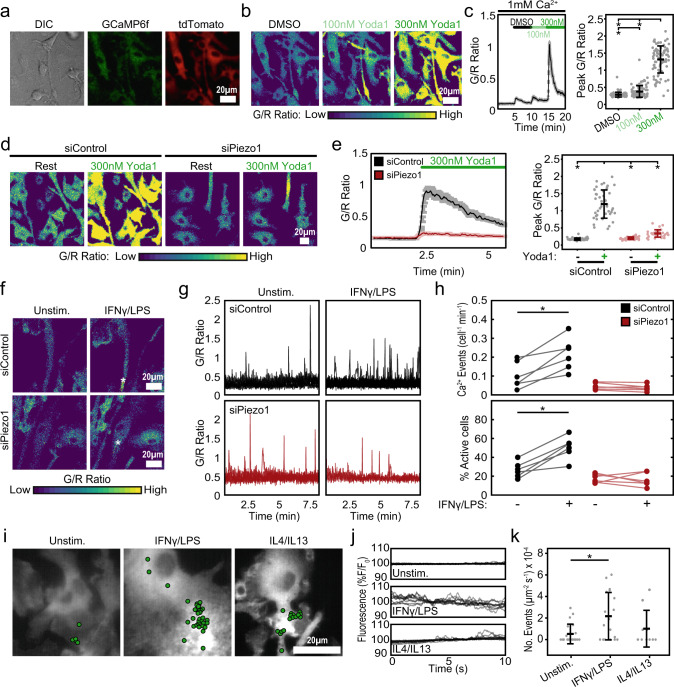
Fig. 2. Regulation of Ca2+ influx by Piezo1 channels in macrophages.
a Representative differential interference contrast (DIC) and fluorescence images showing expression of Salsa6f probe in BMDMs isolated from Vav1-Salsa6f mice, tdTomato is displayed in red and GCaMP6f is displayed in green. b Green:Red (G/R) ratio images showing Ca2+ responses to Yoda1 in Salsa6f+ BMDMs when exposed to DMSO (black), 100 nM (light green), and 300 nM (dark green) Yoda1, all in 1 mM Ca2+ Ringer solution. c G/R traces averaged across all cells in a field of view over time (left) and quantification of peak G/R ratios per cell (right) of Salsa6f+ BMDMs in response to Yoda1. N = 87 cells, representative of three independent experiments, error bars denote Mean ± SD, * p < 0.05 as determined by two-tailed Mann–Whitney U test). d Representative images showing Ca2+ responses to 300 nM Yoda in Salsa6f+ BMDMs treated with either non-target (siControl) or Piezo1 (siPiezo1) siRNA. e G/R traces averaged across all cells in a field of view over time (left) and quantification of peak G/R intensities per cell (right) of siControl and siPiezo1 treated BMDMs exposed to Ringer solution (Rest) or 300 nM Yoda1 in Ringer solution. N = 46 and 31 cells for siControl and siPiezo1 conditions, representative of three independent experiments, error bars denote Mean ± SD, * p < 0.05 as determined by two-tailed Mann–Whitney U test). f–h Representative G/R ratio images (f), traces of individual Ca2+ events (g), and quantification of number of Ca2+ events (normalized for cell number and time) and fraction of cells showing Ca2+ elevations (h) taken from a time-lapse video of siControl and siPiezo1 treated Salsa6f+ BMDMs following acute addition of Ringer solution (Unstim.) or Ringer solution containing 100 ng/mL IFNγ/LPS. Asterisks denote the occurrence of a Ca2+ event. Each data point in (h) denotes a single video (N = 6 videos, * p < 0.05 as determined by two-tailed paired t test). i–k Representative images overlaid with centroids denoting Ca2+ flickers in green (i) and traces of individual Ca2+ flickers (j) recorded in unstimulated, 0.3 ng/mL IFNγ/LPS, and 0.1 ng/mL IL4/IL13 stimulated Salsa6f+ BMDMs using high speed TIRF microscopy. k Frequency of Ca2+ flickers in unstimulated, IFNγ/LPS, and IL4/IL13 stimulated BMDMs. Each data point represents the frequency of Ca2+ flickers in a single video each composed of one or more cells. N = 21, 18, and 10 fields of view for Unstim., IFNγ/LPS and IL4/IL13 conditions, respectively. Error bars denote Mean ± SD, and * p < 0.05 as determined by two-tailed Mann–Whitney U test). Source data including exact p-values are provided as a Source Data file.

