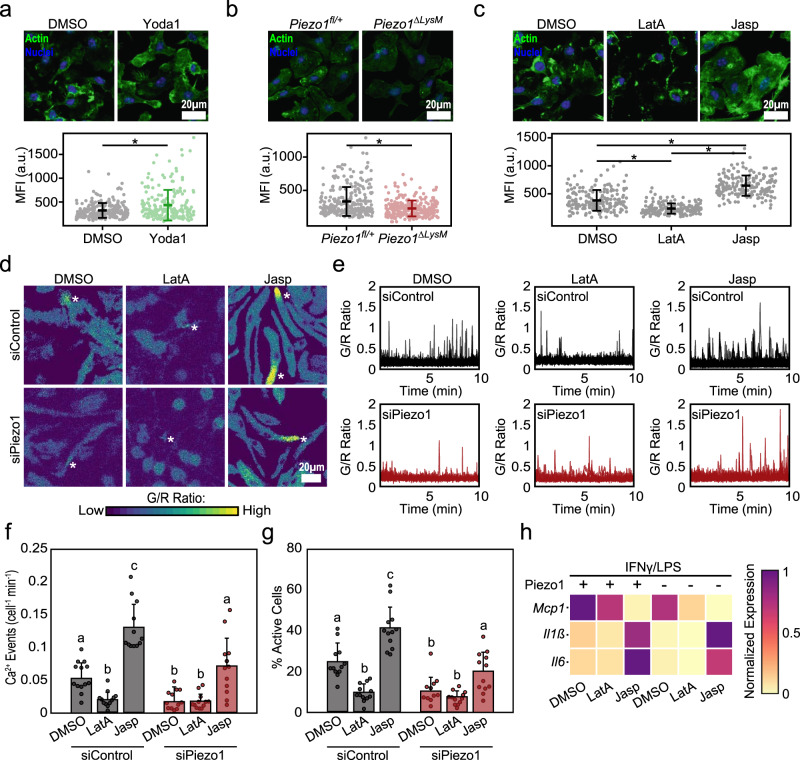
Fig. 5. Piezo1-mediated regulation of actin influences macrophage inflammatory activation.
a Representative images (top) and quantification (bottom) of actin mean fluorescent intensity (MFI) of wild-type BMDMs following 1 h treatment with DMSO or Yoda1. N = 229 and 201 cells examined over three independent experiments for DMSO and Yoda1 treatment. b Representative images (top) and quantification (bottom) of actin MFI of Piezo1fl/+ and Piezo1ΔLysM BMDMs. N = 277 and 279 cells examined over three independent experiments for Piezo1fl/+ and Piezo1ΔLysM BMDMs. c Representative images (top) and quantification (bottom) of actin MFI in BMDMs following one-hour treatment with DMSO, 500 nM latrunculinA (LatA), or 500 nM jasplakinolide (Jasp). N = 195, 177, and 191 cells examined over three independent experiments for DMSO, LatA, and Jasp treatment. d–g Representative G/R ratio images (d), traces of individual Ca2+ events (e), and quantification of number of Ca2+ events (normalized for cell number and time) and fraction of cells showing Ca2+ elevations, (f, g) taken from a time-lapse video of siControl and siPiezo1 treated Salsa6f+ BMDMs following addition of DMSO, LatA, or Jasp in Ringer solution containing 100 ng/mL IFNγ/LPS. Asterisks denote the occurrence of a Ca2+ event. Each data point in (f, g) denotes a single video (N = 12 videos). h Relative Il6, Il1b, and Mcp1 gene expression in Piezo1fl/+ and Piezo1ΔLysM BMDMs exposed to DMSO, LatA, or Jasp and stimulated with IFNγ/LPS for 6 hrs. Gene expression is shown relative to the highest expressing condition. For (a–c), error bars denote Mean ± SD, * p < 0.05 as determined by two-tailed Mann–Whitney U test. For (f, g), error bars denote Mean ± SD for n = 3, groups not connected by the same letter are statistically different (p < 0.05) as determined by two-tailed Student’s t test. Source data including exact p-values are provided as a Source Data file.

