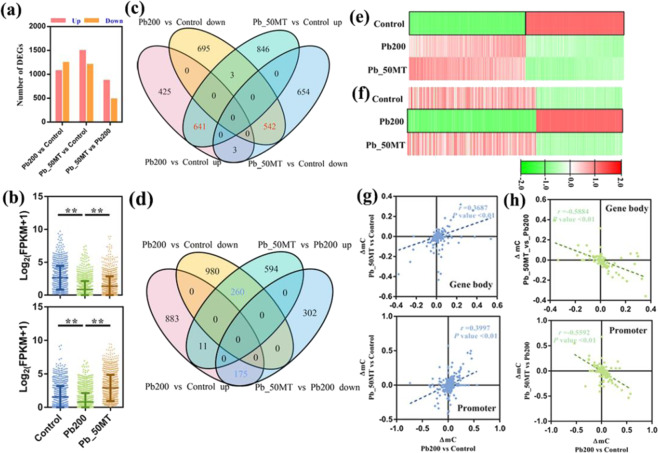
Fig. 4. Expression and methylation patterns of MT-induced DEGs.
a The numbers of up- and downregulated DEGs in Pb200 vs Control, Pb_50MT vs Control, and Pb_50MT vs Pb200. b The expression patterns of Pb200 vs Control downregulated and Pb_50MT vs Pb200 upregulated DEGs. c The overlapping DEGs between Pb200 vs Control and Pb_50MT vs Control. d The overlapping DEGs between Pb200 vs Control and Pb_50MT vs Pb200. e, f The expression patterns of overlapped DEGs. g, h Correlation of differential methylation levels of overlapping DEGs

