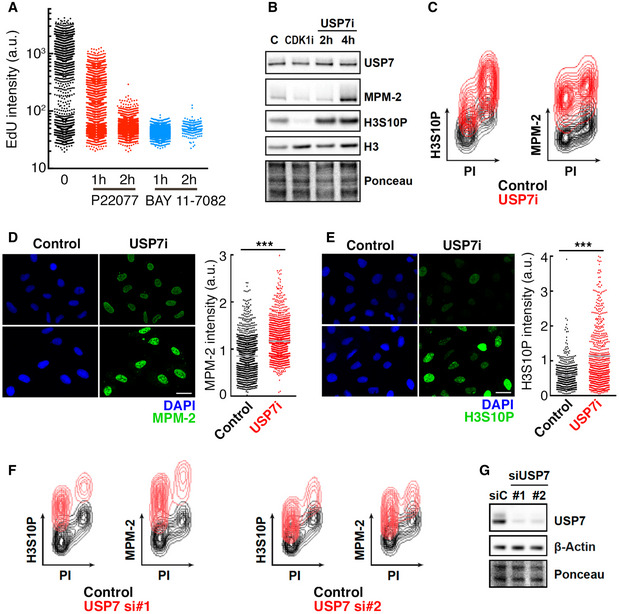
Figure 1. Targeting USP7 triggers mitotic signaling throughout the cell cycle.

-
AHTM of EdU levels per individual nucleus in response to USP7 inhibition in HCT‐116 cells treated with 50 μM P22077 for 1–2 h or 25 μM BAY 11‐7082 for 1–2 h, or with DMSO as a control.
-
BWestern Blot (WB) showing the levels of USP7, MPM‐2, histone H3S10P, and histone H3 in whole nuclear extracts of HCT‐116 cells treated with 50 μM P22077 for 2–4 h (USP7i), 10 μM RO3306 for 8 h (CDK1i), or DMSO as a control. Ponceau staining is shown as a loading control.
-
CFlow cytometry profile illustrating the levels of histone H3S10P (left) and MPM‐2 (right) in HCT‐116 cells in control conditions (control, black) and after treatment with 50 μM P22077 for 4 h (USP7i, red). DNA content was measured with propidium iodide (PI).
-
D, EHTM‐mediated quantification of MPM‐2 (D) and H3S10P (E) levels per individual nucleus in U2OS cells treated with DMSO as a control or 50 μM P22077 (USP7i) for 4 h. Nuclei were stained with DAPI (blue). Scale bar, 30 μm. The quantification is shown to the right of representative images for each analysis (***P < 0.05; t‐test). Gray lines indicate mean values.
-
FFlow cytometry profile representing the levels of histone H3S10P and MPM‐2 in HCT‐116 cells transfected with two different siRNA against USP7 (red; si#1 and si#2) or with a non‐specific siRNA (control, black), for 96 h. DNA content was measured with propidium iodide (PI).
-
GWB illustrating the depletion of USP7 in the HCT‐116 cells used in (F). Experiments were repeated three times, and one representative result is shown.
