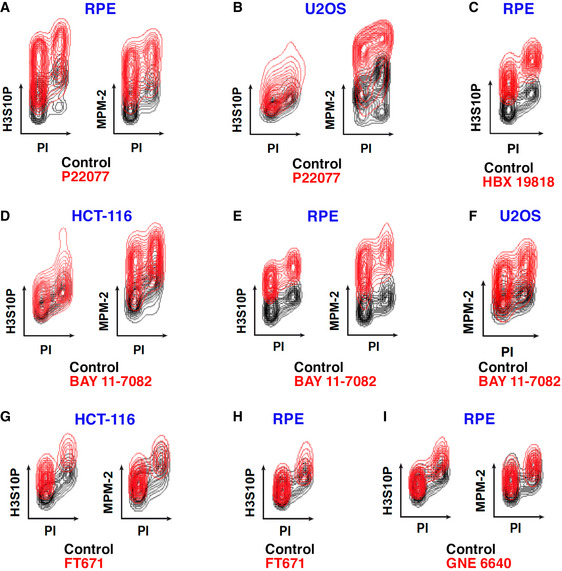
Figure EV1. USP7 inhibitors trigger a widespread accumulation of mitotic signaling events.

-
Flow cytometry profiles illustrating the levels of H3S10P and MPM‐2 in cells either treated with different USP7 inhibitors (red) or with DMSO as a control (black).
-
A, BRPE and U2OS cells treated with 25 or 50 μM P22077 for 4 h, respectively.
-
CRPE cells treated with 50 μM HBX 19818 for 16 h.
-
D, EHCT‐116 (D) and RPE (E) cells treated with 25 μM BAY 11‐7082 for 4 h (H3S10P) and 2 h (MPM‐2).
-
FMPM‐2 levels in U2OS cells treated with 25 μM BAY 11‐7082 for 4 h.
-
G, HHCT‐116 and RPE cells treated with 60 μM FT671 for 16 h.
-
IRPE cells treated with 50 μM GNE‐6640 for 8 h (H3S10P) and 24 h (MPM‐2).
