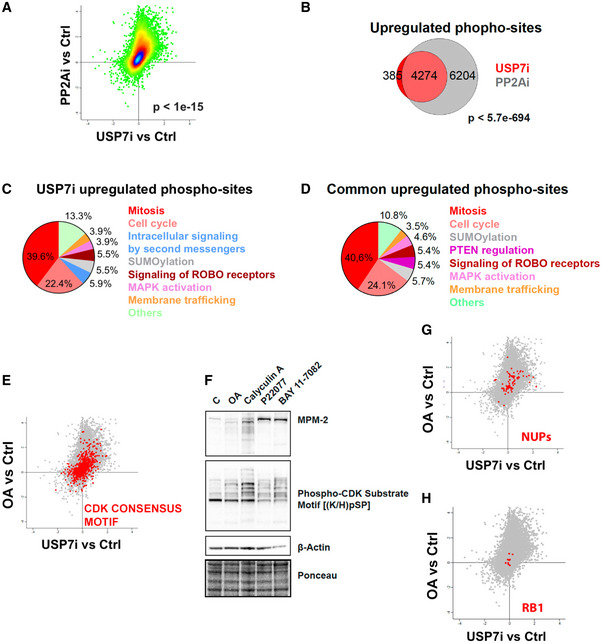
Figure 4. USP7 inhibition phenocopies the changes in the phosphoproteome induced by OA.

-
APhosphoproteome‐wide correlation between the effects observed upon USP7i and OA treatments (4 and 2 h, respectively) in RPE cells. The P‐value was obtained by a t‐test to evaluate the Pearson correlation between both samples.
-
BVenn diagrams representing the overlap between the peptides that show increased levels of phosphorylation upon USP7i and OA treatments. The P‐value was obtained by a hypergeometric test.
-
C, DReactome analysis illustrating the biological pathways related to the factors that show increased phosphorylation upon treatment with USP7i or that are commonly upregulated in response to USP7i and OA.
-
ERepresentation of the phosphorylation levels at epitopes that follow the CDK consensus motif p(S/T)Px(K/R) upon USP7i or OA treatments from data obtained at phosphoproteomic analyses.
-
FWestern blot showing the levels of MPM‐2, phosphor‐CDK substrate motif [(K/H)pSP], and β‐Actin in whole cell extracts of RPE cells treated with DMSO (control), 0.5 μM okadaic acid (OA) for 2 h, 10 nM calyculin A for 2 h, 25 μM P22077 for 4 h, or 25 μM BAY 11‐7082 for 2 h. Calyculin A was added to this experiment to illustrate the gain in CDK activity induced by an additional PP2A inhibitor. Ponceau staining is shown as loading control.
-
G, HRepresentation of the phosphorylation levels at epitopes from nucleoporins (NUPs; (G)) or retinoblastoma (RB1; (H)) upon USP7i or OA treatments from data obtained at phosphoproteomic analyses.
