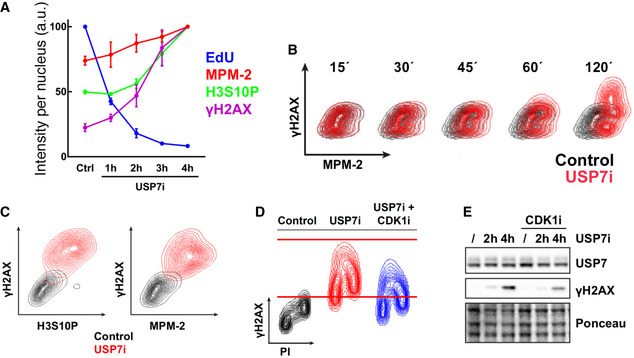
Figure 5. USP7 suppresses CDK1‐dependent DNA damage.

- HTM‐dependent quantification of EdU, γH2AX, H3S10P, and MPM‐2 levels per individual nucleus in U2OS cells treated with 50 μM P22077 (USP7i) for the indicated times or with DMSO as a control. Quantification data derived from three independent experiments. Data represent mean values ± SEM. N > 2,000 cells analyzed per condition.
- Flow cytometry profiles illustrating the levels of γH2AX and MPM‐2 in U2OS cells in control conditions (control, black) and after treatment with 50 μM P22077 for the indicated times (USP7i, red). Experiments were repeated three times, and one representative result is shown.
- Flow cytometry profiles representing the correlation between γH2AX and MPM‐2 or histone H3S10P signals in HCT‐116 cells treated with DMSO (control) or 50 μM P22077 for 8 h (USP7i).
- Flow cytometry profiles representing the levels of γH2AX in HCT‐116 cells in control conditions or after treatment with 50 μM P22077 (USP7i) for 4 h alone or in combination with 10 μM RO3306 (USP7i + CDK1i) for 4 h. DNA content was measured with propidium iodide (PI).
