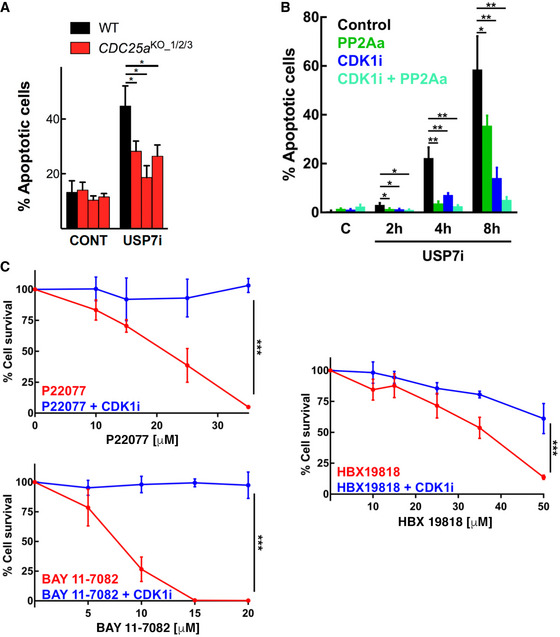
Figure 6. USP7 inhibitors induce CDK1‐dependent cell death.

- Percentage of apoptotic cells in WT and CDC25a KO mESC after treatment with DMSO (CONT) and 25 μM P22077 (USP7i) for 16 h. This experiment was repeated four times using three different CDC25A clones (*P < 0.05; t‐test). Bars represent mean values ± SEM.
- Quantification of apoptotic induction was measured by flow cytometry in RPE cells after treatment with DMSO as a control, 25 μM P22077 (USP7i), 10 μM RO3306 (CDK1i), or 10 μM DT‐061 (PP2Aa), and their combinations for the indicated times. DNA content was followed with Hoechst, and the mitochondrial membrane potential was measured by TMRE. The percentage of apoptotic cells (TMRE negative) is indicated for each condition. This experiment was repeated three times (*P < 0.05 and **P < 0.01; t‐test). Bars represent mean values ± SEM.
- GLO viability assay in cells treated with three independent USP7 inhibitors (P22077, BAY 11‐7082, or HBX 19818) alone or in combination with a 24‐h treatment of 10 μM RO3306 (CDK1i). This experiment was repeated three times. Data represent mean values ± SEM (***P < 0.05; ANOVA).
