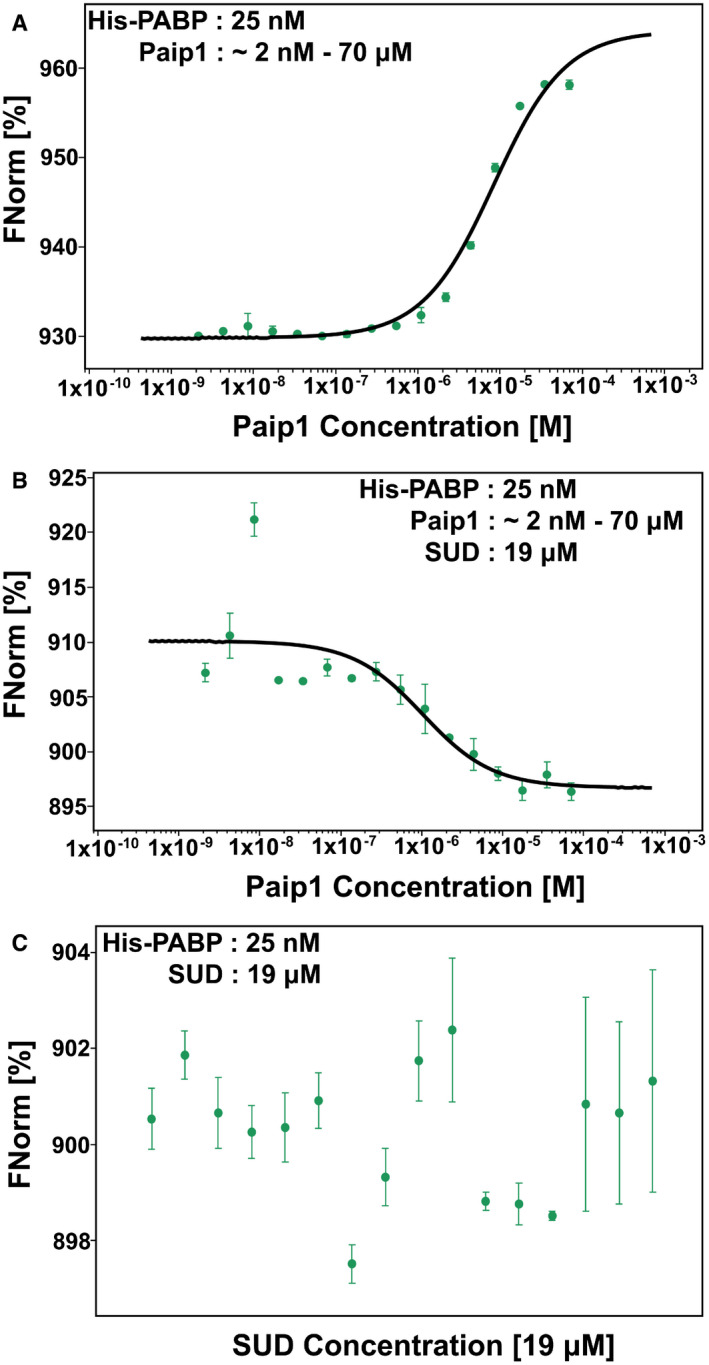
Figure EV1. SUD enhances the interaction between PABP and Paip1.

- Curve fit of micro‐scale thermophoresis (MST) traces for the determination of the Paip1 and PABP‐binding affinity (K d = 8.4 ± 1.5 μM).
- Curve fit of MST traces for determination of the Paip1 and PABP‐binding affinity upon adding SUD (K d = 1.9 ± 0.6 μM).
- Control: SUD and PABP display no binding affinity.
Data information: Data are shown as the mean ± SD from two independent replicates.
