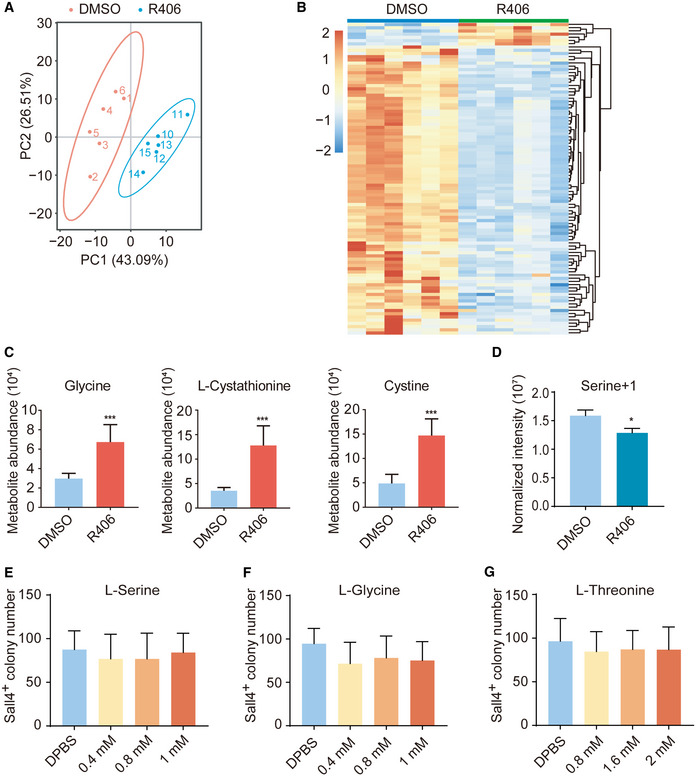
Figure EV4. More characterization of metabolomics.

-
APrincipal component analysis of analyzed metabolites in DMSO‐treated samples and R406‐treated samples on d8. n = 6.
-
BHeatmap showing the normalized abundance (z score) of the differential metabolites between DMSO‐treated and R406‐treated samples. Red indicates upregulated, whereas blue indicates downregulated metabolites. n = 6.
-
CAbundance of R406‐upregulated metabolites in glycine, serine, and threonine metabolism in cells treated with DMSO and R406. n = 6.
-
DStable isotope tracing mass spectrometry using 13C‐labeled Serine in cells treated with DMSO and R406. n = 3.
-
E–GSall4+ colony number on d12 after treatments with l‐serine, l‐glycine, and l‐threonine. n = 5.
Data information: All data are presented as mean ± SD. Statistical significance was assessed by the two‐tailed Student’s t‐test, *P < 0.05, ***P < 0.001.
