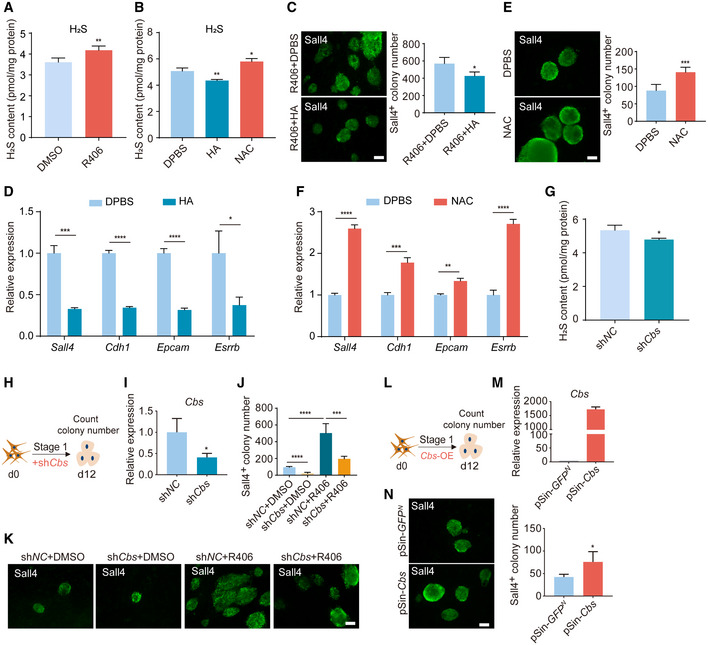
Figure 5. R406 can upregulate cellular H2S level and H2S can promote chemical reprogramming.

-
AH2S levels in DMSO‐ and R406‐treated reprogramming intermediates detected by monobromobimane method. n = 4.
-
BH2S levels in reprogramming intermediates treated with DPBS, HA, and NAC. n = 3.
-
CImmunofluorescence of Sall4 in reprogramming intermediates treated by R406 + HA and R406 + DPBS on d12. n = 3. Scale bar, 100 μm.
-
DRT–qPCR analysis of Sall4, Cdh1, Epcam, and Esrrb gene expression in DPBS‐ and HA‐treated cells on d12. n = 3.
-
EImmunofluorescence of Sall4 in NAC‐ and DPBS‐treated cells on d12. n = 5. Scale bar, 100 μm.
-
FRT–qPCR analysis of Sall4, Cdh1, Epcam, and Esrrb gene expression in DPBS‐ and NAC‐treated cells on d12. n = 3.
-
GH2S levels in reprogramming intermediates treated with shNC and shCbs. n = 3.
-
HDiagram showing the procedure of reprogramming infected with shRNA for Cbs.
-
IRT–qPCR analysis of Cbs expression in MEFs infected with shNC and shCbs. n = 3.
-
J, KImmunofluorescence of Sall4 in shNC‐ and shCbs‐infected cells with and without R406 treatment on d12. n = 5. Scale bar, 100 μm.
-
LDiagram showing the procedure of reprogramming infected with Cbs‐OE (pSin‐Cbs) virus.
-
MRT–qPCR analysis of Cbs expression in MEFs infected with pSin‐GFPN and pSin‐Cbs viruses. n = 3.
-
NImmunofluorescence of Sall4 in WT cells and Cbs overexpressing cells on d12. n = 4. Scale bar, 100 μm.
Data information: All data are presented as mean ± SD. Statistical significance was assessed by the two‐tailed Student’s t‐test, *P < 0.05, **P < 0.01, ***P < 0.001, ****P < 0.0001. See also Fig EV5.
